Immigrants from Nicaragua Married-couple Households
COMPARE
Immigrants from Nicaragua
Select to Compare
Married-couple Households
Immigrants from Nicaragua Married-couple Households
44.5%
MARRIED-COUPLE HOUSEHOLDS
1.2/ 100
METRIC RATING
235th/ 347
METRIC RANK
Immigrants from Nicaragua Married-couple Households Correlation Chart
The statistical analysis conducted on geographies consisting of 236,322,720 people shows a slight negative correlation between the proportion of Immigrants from Nicaragua and percentage of married-couple family households in the United States with a correlation coefficient (R) of -0.067 and weighted average of 44.5%. On average, for every 1% (one percent) increase in Immigrants from Nicaragua within a typical geography, there is a decrease of 0.18% in percentage of married-couple family households.
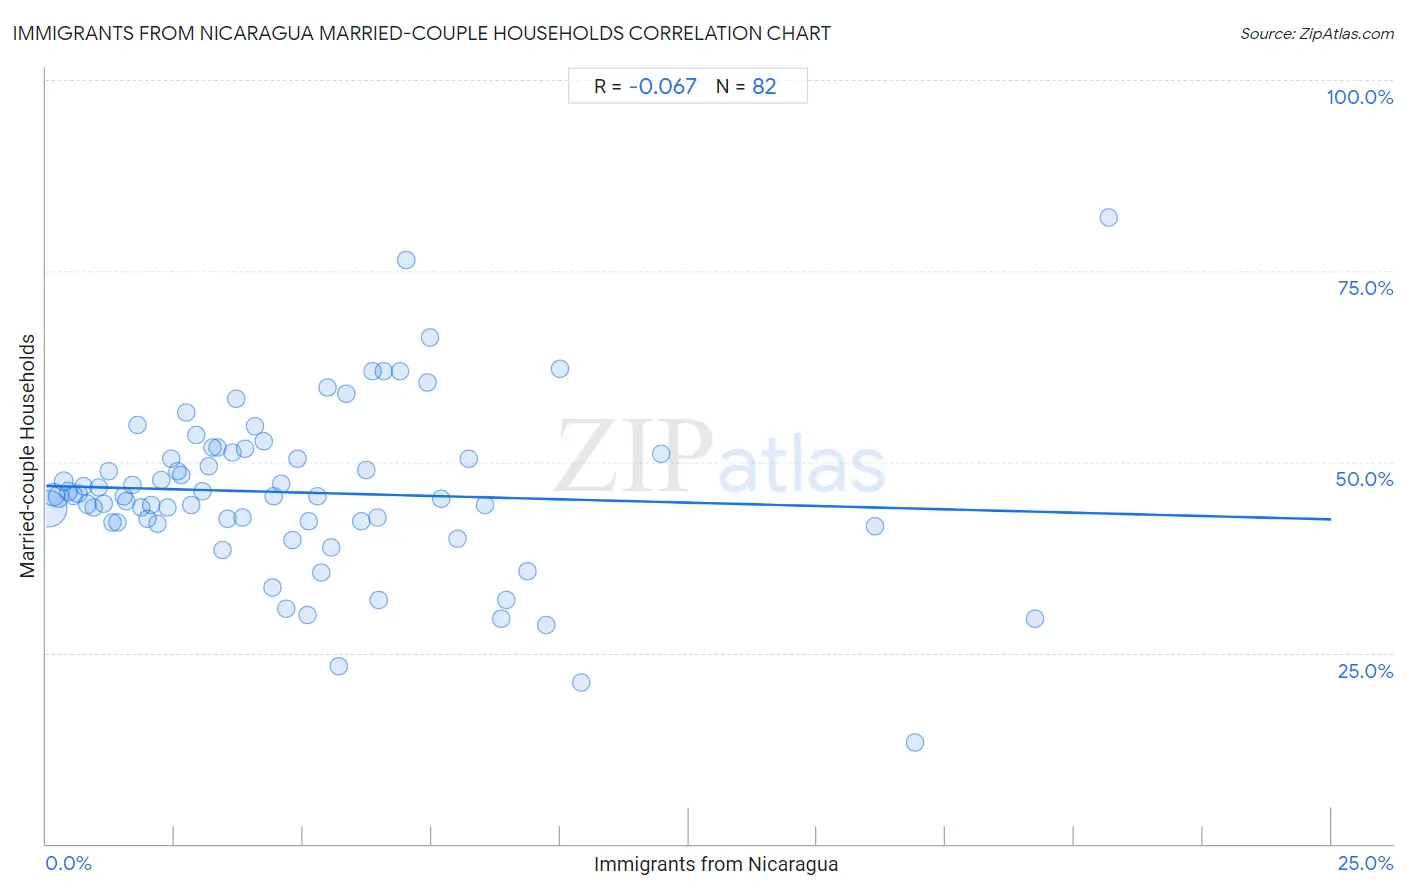
It is essential to understand that the correlation between the percentage of Immigrants from Nicaragua and percentage of married-couple family households does not imply a direct cause-and-effect relationship. It remains uncertain whether the presence of Immigrants from Nicaragua influences an upward or downward trend in the level of percentage of married-couple family households within an area, or if Immigrants from Nicaragua simply ended up residing in those areas with higher or lower levels of percentage of married-couple family households due to other factors.
Demographics Similar to Immigrants from Nicaragua by Married-couple Households
In terms of married-couple households, the demographic groups most similar to Immigrants from Nicaragua are Yaqui (44.5%, a difference of 0.0%), Comanche (44.5%, a difference of 0.040%), Immigrants from Panama (44.6%, a difference of 0.070%), Immigrants from Uruguay (44.5%, a difference of 0.090%), and Spanish American (44.5%, a difference of 0.10%).
| Demographics | Rating | Rank | Married-couple Households |
| Kenyans | 1.7 /100 | #228 | Tragic 44.7% |
| Immigrants from Latin America | 1.6 /100 | #229 | Tragic 44.7% |
| Soviet Union | 1.6 /100 | #230 | Tragic 44.6% |
| Houma | 1.5 /100 | #231 | Tragic 44.6% |
| Marshallese | 1.5 /100 | #232 | Tragic 44.6% |
| Immigrants from Uganda | 1.5 /100 | #233 | Tragic 44.6% |
| Immigrants from Panama | 1.3 /100 | #234 | Tragic 44.6% |
| Immigrants from Nicaragua | 1.2 /100 | #235 | Tragic 44.5% |
| Yaqui | 1.2 /100 | #236 | Tragic 44.5% |
| Comanche | 1.2 /100 | #237 | Tragic 44.5% |
| Immigrants from Uruguay | 1.1 /100 | #238 | Tragic 44.5% |
| Spanish Americans | 1.1 /100 | #239 | Tragic 44.5% |
| Ute | 1.0 /100 | #240 | Tragic 44.4% |
| Immigrants from Bosnia and Herzegovina | 1.0 /100 | #241 | Tragic 44.4% |
| Immigrants from Albania | 1.0 /100 | #242 | Tragic 44.4% |
Immigrants from Nicaragua Married-couple Households Correlation Summary
| Measurement | Immigrants from Nicaragua Data | Married-couple Households Data |
| Minimum | 0.043% | 13.2% |
| Maximum | 20.7% | 82.0% |
| Range | 20.6% | 68.8% |
| Mean | 4.9% | 46.0% |
| Median | 4.0% | 45.5% |
| Interquartile 25% (IQ1) | 2.0% | 42.1% |
| Interquartile 75% (IQ3) | 6.5% | 51.0% |
| Interquartile Range (IQR) | 4.5% | 9.0% |
| Standard Deviation (Sample) | 4.1% | 10.9% |
| Standard Deviation (Population) | 4.1% | 10.9% |
Correlation Details
| Immigrants from Nicaragua Percentile | Sample Size | Married-couple Households |
[ 0.0% - 0.5% ] 0.043% | 137,854,631 | 43.8% |
[ 0.0% - 0.5% ] 0.14% | 42,567,432 | 45.7% |
[ 0.0% - 0.5% ] 0.23% | 22,016,134 | 45.5% |
[ 0.0% - 0.5% ] 0.33% | 9,309,485 | 47.4% |
[ 0.0% - 0.5% ] 0.43% | 6,563,063 | 46.1% |
[ 0.5% - 1.0% ] 0.52% | 3,482,575 | 45.6% |
[ 0.5% - 1.0% ] 0.62% | 2,788,859 | 45.8% |
[ 0.5% - 1.0% ] 0.72% | 1,656,770 | 46.8% |
[ 0.5% - 1.0% ] 0.81% | 1,762,520 | 44.5% |
[ 0.5% - 1.0% ] 0.91% | 970,008 | 44.1% |
[ 1.0% - 1.5% ] 1.01% | 680,913 | 46.6% |
[ 1.0% - 1.5% ] 1.12% | 611,167 | 44.5% |
[ 1.0% - 1.5% ] 1.21% | 501,792 | 48.8% |
[ 1.0% - 1.5% ] 1.30% | 498,553 | 42.1% |
[ 1.0% - 1.5% ] 1.38% | 294,776 | 42.0% |
[ 1.0% - 1.5% ] 1.50% | 469,564 | 45.4% |
[ 1.5% - 2.0% ] 1.56% | 264,687 | 44.8% |
[ 1.5% - 2.0% ] 1.68% | 301,897 | 47.0% |
[ 1.5% - 2.0% ] 1.77% | 39,282 | 54.8% |
[ 1.5% - 2.0% ] 1.85% | 215,724 | 44.0% |
[ 1.5% - 2.0% ] 1.98% | 60,301 | 42.6% |
[ 2.0% - 2.5% ] 2.05% | 267,160 | 44.3% |
[ 2.0% - 2.5% ] 2.17% | 29,198 | 41.8% |
[ 2.0% - 2.5% ] 2.23% | 59,190 | 47.6% |
[ 2.0% - 2.5% ] 2.35% | 44,312 | 44.1% |
[ 2.0% - 2.5% ] 2.42% | 248,977 | 50.4% |
[ 2.5% - 3.0% ] 2.55% | 173,321 | 48.8% |
[ 2.5% - 3.0% ] 2.62% | 67,641 | 48.3% |
[ 2.5% - 3.0% ] 2.72% | 55,241 | 56.5% |
[ 2.5% - 3.0% ] 2.82% | 23,394 | 44.3% |
[ 2.5% - 3.0% ] 2.92% | 104,866 | 53.4% |
[ 3.0% - 3.5% ] 3.03% | 142,707 | 46.2% |
[ 3.0% - 3.5% ] 3.16% | 133,929 | 49.5% |
[ 3.0% - 3.5% ] 3.23% | 118,950 | 51.9% |
[ 3.0% - 3.5% ] 3.33% | 21,667 | 51.8% |
[ 3.0% - 3.5% ] 3.43% | 176,909 | 38.5% |
[ 3.5% - 4.0% ] 3.52% | 226,831 | 42.6% |
[ 3.5% - 4.0% ] 3.64% | 4,209 | 51.2% |
[ 3.5% - 4.0% ] 3.69% | 96,536 | 58.3% |
[ 3.5% - 4.0% ] 3.81% | 4,987 | 42.7% |
[ 3.5% - 4.0% ] 3.87% | 80,755 | 51.7% |
[ 4.0% - 4.5% ] 4.06% | 60,592 | 54.7% |
[ 4.0% - 4.5% ] 4.24% | 50,106 | 52.7% |
[ 4.0% - 4.5% ] 4.40% | 44,062 | 33.5% |
[ 4.0% - 4.5% ] 4.44% | 496 | 45.5% |
[ 4.5% - 5.0% ] 4.58% | 63,650 | 47.1% |
[ 4.5% - 5.0% ] 4.67% | 444,748 | 30.8% |
[ 4.5% - 5.0% ] 4.80% | 49,347 | 39.7% |
[ 4.5% - 5.0% ] 4.88% | 105,852 | 50.4% |
[ 5.0% - 5.5% ] 5.09% | 47,065 | 30.0% |
[ 5.0% - 5.5% ] 5.11% | 30,980 | 42.3% |
[ 5.0% - 5.5% ] 5.28% | 45,620 | 45.5% |
[ 5.0% - 5.5% ] 5.36% | 1,979 | 35.4% |
[ 5.0% - 5.5% ] 5.47% | 822 | 59.7% |
[ 5.5% - 6.0% ] 5.54% | 85,736 | 38.7% |
[ 5.5% - 6.0% ] 5.69% | 14,698 | 23.2% |
[ 5.5% - 6.0% ] 5.83% | 309 | 58.9% |
[ 6.0% - 6.5% ] 6.14% | 5,049 | 42.3% |
[ 6.0% - 6.5% ] 6.22% | 16,776 | 48.9% |
[ 6.0% - 6.5% ] 6.34% | 867 | 61.9% |
[ 6.0% - 6.5% ] 6.44% | 34,335 | 42.7% |
[ 6.0% - 6.5% ] 6.47% | 59,121 | 31.8% |
[ 6.5% - 7.0% ] 6.56% | 457 | 61.9% |
[ 6.5% - 7.0% ] 6.89% | 740 | 61.8% |
[ 6.5% - 7.0% ] 7.00% | 443 | 76.5% |
[ 7.0% - 7.5% ] 7.41% | 297 | 60.4% |
[ 7.0% - 7.5% ] 7.46% | 469 | 66.3% |
[ 7.5% - 8.0% ] 7.68% | 924 | 45.1% |
[ 8.0% - 8.5% ] 8.00% | 475 | 40.0% |
[ 8.0% - 8.5% ] 8.21% | 1,194 | 50.3% |
[ 8.5% - 9.0% ] 8.53% | 40,278 | 44.3% |
[ 8.5% - 9.0% ] 8.86% | 34,742 | 29.4% |
[ 8.5% - 9.0% ] 8.96% | 54,873 | 32.0% |
[ 9.0% - 9.5% ] 9.36% | 844 | 35.7% |
[ 9.5% - 10.0% ] 9.73% | 514 | 28.7% |
[ 9.5% - 10.0% ] 10.00% | 2,041 | 62.1% |
[ 10.0% - 10.5% ] 10.40% | 8,989 | 21.2% |
[ 11.5% - 12.0% ] 11.95% | 778 | 51.0% |
[ 16.0% - 16.5% ] 16.11% | 19,399 | 41.7% |
[ 16.5% - 17.0% ] 16.89% | 296 | 13.2% |
[ 19.0% - 19.5% ] 19.24% | 1,694 | 29.5% |
[ 20.5% - 21.0% ] 20.67% | 150 | 82.0% |