Immigrants from Nicaragua GED/Equivalency
COMPARE
Immigrants from Nicaragua
Select to Compare
GED/Equivalency
Immigrants from Nicaragua GED/Equivalency
79.9%
GED/EQUIVALENCY
0.0/ 100
METRIC RATING
323rd/ 347
METRIC RANK
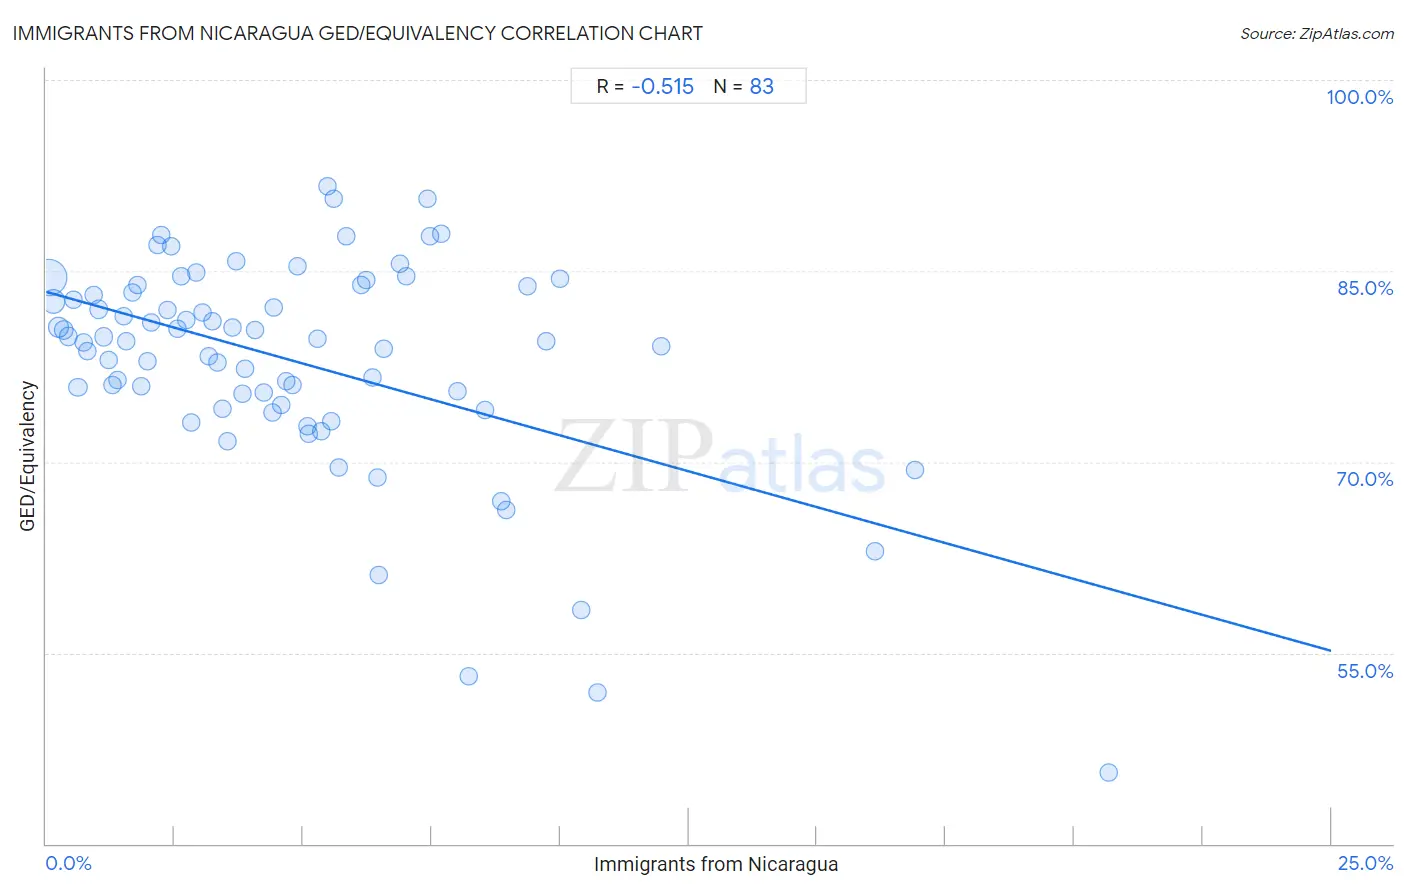
Immigrants from Nicaragua GED/Equivalency Correlation Chart
The statistical analysis conducted on geographies consisting of 236,340,156 people shows a substantial negative correlation between the proportion of Immigrants from Nicaragua and percentage of population with at least ged/equivalency education in the United States with a correlation coefficient (R) of -0.515 and weighted average of 79.9%. On average, for every 1% (one percent) increase in Immigrants from Nicaragua within a typical geography, there is a decrease of 1.1% in percentage of population with at least ged/equivalency education.
It is essential to understand that the correlation between the percentage of Immigrants from Nicaragua and percentage of population with at least ged/equivalency education does not imply a direct cause-and-effect relationship. It remains uncertain whether the presence of Immigrants from Nicaragua influences an upward or downward trend in the level of percentage of population with at least ged/equivalency education within an area, or if Immigrants from Nicaragua simply ended up residing in those areas with higher or lower levels of percentage of population with at least ged/equivalency education due to other factors.
Demographics Similar to Immigrants from Nicaragua by GED/Equivalency
In terms of ged/equivalency, the demographic groups most similar to Immigrants from Nicaragua are Lumbee (80.0%, a difference of 0.12%), Yup'ik (80.0%, a difference of 0.19%), Immigrants from Cuba (80.2%, a difference of 0.36%), Mexican American Indian (79.4%, a difference of 0.65%), and Honduran (79.3%, a difference of 0.76%).
| Demographics | Rating | Rank | GED/Equivalency |
| Central American Indians | 0.0 /100 | #316 | Tragic 80.6% |
| Immigrants from Caribbean | 0.0 /100 | #317 | Tragic 80.5% |
| Yaqui | 0.0 /100 | #318 | Tragic 80.5% |
| Immigrants from Belize | 0.0 /100 | #319 | Tragic 80.5% |
| Immigrants from Cuba | 0.0 /100 | #320 | Tragic 80.2% |
| Yup'ik | 0.0 /100 | #321 | Tragic 80.0% |
| Lumbee | 0.0 /100 | #322 | Tragic 80.0% |
| Immigrants from Nicaragua | 0.0 /100 | #323 | Tragic 79.9% |
| Mexican American Indians | 0.0 /100 | #324 | Tragic 79.4% |
| Hondurans | 0.0 /100 | #325 | Tragic 79.3% |
| Yuman | 0.0 /100 | #326 | Tragic 79.2% |
| Central Americans | 0.0 /100 | #327 | Tragic 79.2% |
| Hispanics or Latinos | 0.0 /100 | #328 | Tragic 79.1% |
| Dominicans | 0.0 /100 | #329 | Tragic 79.1% |
| Immigrants from Cabo Verde | 0.0 /100 | #330 | Tragic 78.9% |
Immigrants from Nicaragua GED/Equivalency Correlation Summary
| Measurement | Immigrants from Nicaragua Data | GED/Equivalency Data |
| Minimum | 0.043% | 45.6% |
| Maximum | 20.7% | 91.7% |
| Range | 20.6% | 46.1% |
| Mean | 4.8% | 77.9% |
| Median | 4.1% | 79.5% |
| Interquartile 25% (IQ1) | 2.0% | 74.4% |
| Interquartile 75% (IQ3) | 6.5% | 83.8% |
| Interquartile Range (IQR) | 4.5% | 9.3% |
| Standard Deviation (Sample) | 3.9% | 8.4% |
| Standard Deviation (Population) | 3.8% | 8.4% |
Correlation Details
| Immigrants from Nicaragua Percentile | Sample Size | GED/Equivalency |
[ 0.0% - 0.5% ] 0.043% | 137,858,738 | 84.5% |
[ 0.0% - 0.5% ] 0.14% | 42,576,470 | 82.6% |
[ 0.0% - 0.5% ] 0.23% | 22,016,134 | 80.6% |
[ 0.0% - 0.5% ] 0.33% | 9,312,274 | 80.3% |
[ 0.0% - 0.5% ] 0.43% | 6,565,495 | 79.8% |
[ 0.5% - 1.0% ] 0.52% | 3,482,575 | 82.7% |
[ 0.5% - 1.0% ] 0.62% | 2,788,859 | 75.8% |
[ 0.5% - 1.0% ] 0.72% | 1,656,770 | 79.4% |
[ 0.5% - 1.0% ] 0.81% | 1,762,520 | 78.7% |
[ 0.5% - 1.0% ] 0.91% | 970,008 | 83.1% |
[ 1.0% - 1.5% ] 1.01% | 680,913 | 82.0% |
[ 1.0% - 1.5% ] 1.12% | 611,167 | 79.8% |
[ 1.0% - 1.5% ] 1.21% | 501,792 | 78.0% |
[ 1.0% - 1.5% ] 1.30% | 498,553 | 76.1% |
[ 1.0% - 1.5% ] 1.38% | 294,776 | 76.4% |
[ 1.0% - 1.5% ] 1.50% | 469,564 | 81.4% |
[ 1.5% - 2.0% ] 1.56% | 264,687 | 79.5% |
[ 1.5% - 2.0% ] 1.68% | 301,897 | 83.3% |
[ 1.5% - 2.0% ] 1.77% | 39,614 | 83.9% |
[ 1.5% - 2.0% ] 1.85% | 215,724 | 75.9% |
[ 1.5% - 2.0% ] 1.98% | 60,301 | 77.9% |
[ 2.0% - 2.5% ] 2.05% | 267,160 | 80.9% |
[ 2.0% - 2.5% ] 2.17% | 29,198 | 87.0% |
[ 2.0% - 2.5% ] 2.23% | 59,190 | 87.9% |
[ 2.0% - 2.5% ] 2.35% | 44,312 | 81.9% |
[ 2.0% - 2.5% ] 2.42% | 248,977 | 86.9% |
[ 2.5% - 3.0% ] 2.55% | 173,321 | 80.5% |
[ 2.5% - 3.0% ] 2.62% | 67,641 | 84.5% |
[ 2.5% - 3.0% ] 2.72% | 55,241 | 81.1% |
[ 2.5% - 3.0% ] 2.82% | 23,394 | 73.1% |
[ 2.5% - 3.0% ] 2.92% | 104,866 | 84.8% |
[ 3.0% - 3.5% ] 3.03% | 142,707 | 81.7% |
[ 3.0% - 3.5% ] 3.16% | 133,929 | 78.3% |
[ 3.0% - 3.5% ] 3.23% | 118,950 | 81.0% |
[ 3.0% - 3.5% ] 3.33% | 21,667 | 77.8% |
[ 3.0% - 3.5% ] 3.43% | 176,909 | 74.1% |
[ 3.5% - 4.0% ] 3.52% | 226,831 | 71.7% |
[ 3.5% - 4.0% ] 3.64% | 4,209 | 80.5% |
[ 3.5% - 4.0% ] 3.69% | 96,536 | 85.8% |
[ 3.5% - 4.0% ] 3.81% | 4,987 | 75.3% |
[ 3.5% - 4.0% ] 3.87% | 80,755 | 77.3% |
[ 4.0% - 4.5% ] 4.06% | 60,592 | 80.3% |
[ 4.0% - 4.5% ] 4.24% | 50,106 | 75.4% |
[ 4.0% - 4.5% ] 4.40% | 44,062 | 73.9% |
[ 4.0% - 4.5% ] 4.44% | 496 | 82.1% |
[ 4.5% - 5.0% ] 4.58% | 63,650 | 74.4% |
[ 4.5% - 5.0% ] 4.67% | 444,748 | 76.3% |
[ 4.5% - 5.0% ] 4.80% | 49,347 | 76.1% |
[ 4.5% - 5.0% ] 4.88% | 105,852 | 85.4% |
[ 5.0% - 5.5% ] 5.09% | 47,065 | 72.8% |
[ 5.0% - 5.5% ] 5.11% | 30,980 | 72.2% |
[ 5.0% - 5.5% ] 5.28% | 45,620 | 79.7% |
[ 5.0% - 5.5% ] 5.36% | 1,979 | 72.4% |
[ 5.0% - 5.5% ] 5.47% | 822 | 91.7% |
[ 5.5% - 6.0% ] 5.54% | 85,736 | 73.2% |
[ 5.5% - 6.0% ] 5.59% | 143 | 90.7% |
[ 5.5% - 6.0% ] 5.69% | 14,698 | 69.5% |
[ 5.5% - 6.0% ] 5.83% | 309 | 87.7% |
[ 6.0% - 6.5% ] 6.14% | 5,049 | 83.9% |
[ 6.0% - 6.5% ] 6.22% | 16,776 | 84.3% |
[ 6.0% - 6.5% ] 6.34% | 867 | 76.6% |
[ 6.0% - 6.5% ] 6.44% | 34,335 | 68.8% |
[ 6.0% - 6.5% ] 6.47% | 59,121 | 61.1% |
[ 6.5% - 7.0% ] 6.56% | 457 | 78.8% |
[ 6.5% - 7.0% ] 6.89% | 740 | 85.5% |
[ 6.5% - 7.0% ] 7.00% | 443 | 84.6% |
[ 7.0% - 7.5% ] 7.41% | 297 | 90.7% |
[ 7.0% - 7.5% ] 7.46% | 469 | 87.7% |
[ 7.5% - 8.0% ] 7.68% | 924 | 87.9% |
[ 8.0% - 8.5% ] 8.00% | 475 | 75.5% |
[ 8.0% - 8.5% ] 8.21% | 1,194 | 53.2% |
[ 8.5% - 9.0% ] 8.53% | 40,278 | 74.1% |
[ 8.5% - 9.0% ] 8.86% | 34,742 | 66.9% |
[ 8.5% - 9.0% ] 8.96% | 54,873 | 66.2% |
[ 9.0% - 9.5% ] 9.36% | 844 | 83.8% |
[ 9.5% - 10.0% ] 9.73% | 514 | 79.5% |
[ 9.5% - 10.0% ] 10.00% | 2,041 | 84.4% |
[ 10.0% - 10.5% ] 10.40% | 8,989 | 58.4% |
[ 10.5% - 11.0% ] 10.73% | 289 | 51.9% |
[ 11.5% - 12.0% ] 11.95% | 778 | 79.1% |
[ 16.0% - 16.5% ] 16.11% | 19,399 | 63.0% |
[ 16.5% - 17.0% ] 16.89% | 296 | 69.4% |
[ 20.5% - 21.0% ] 20.67% | 150 | 45.6% |