Immigrants from Nicaragua Disability Age Under 5
COMPARE
Immigrants from Nicaragua
Select to Compare
Disability Age Under 5
Immigrants from Nicaragua Disability Age Under 5
1.2%
DISABILITY | AGE UNDER 5
96.0/ 100
METRIC RATING
103rd/ 347
METRIC RANK
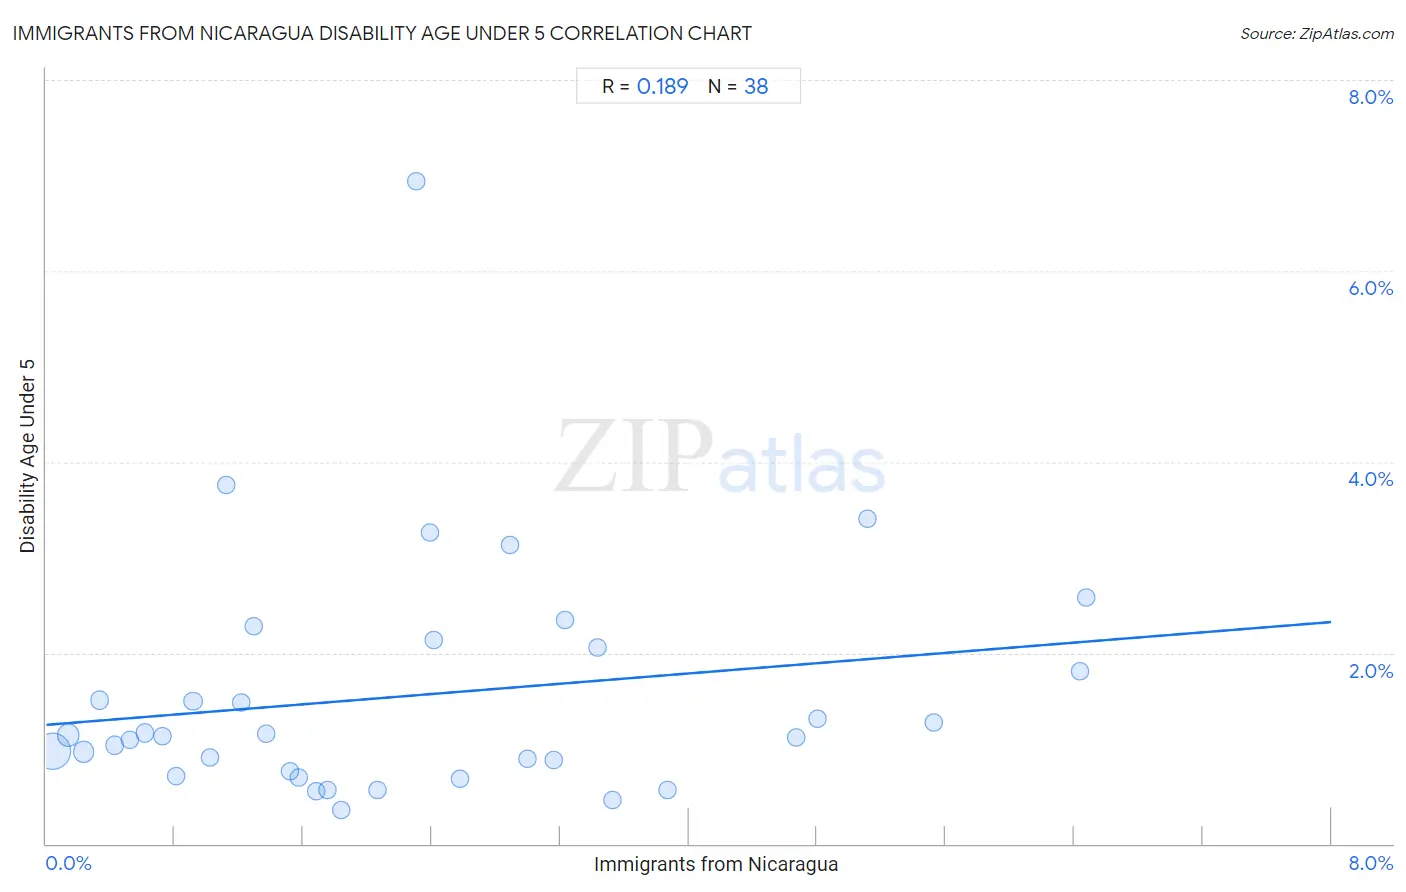
Immigrants from Nicaragua Disability Age Under 5 Correlation Chart
The statistical analysis conducted on geographies consisting of 152,236,071 people shows a poor positive correlation between the proportion of Immigrants from Nicaragua and percentage of population with a disability under the age of 5 in the United States with a correlation coefficient (R) of 0.189 and weighted average of 1.2%. On average, for every 1% (one percent) increase in Immigrants from Nicaragua within a typical geography, there is an increase of 0.13% in percentage of population with a disability under the age of 5.
It is essential to understand that the correlation between the percentage of Immigrants from Nicaragua and percentage of population with a disability under the age of 5 does not imply a direct cause-and-effect relationship. It remains uncertain whether the presence of Immigrants from Nicaragua influences an upward or downward trend in the level of percentage of population with a disability under the age of 5 within an area, or if Immigrants from Nicaragua simply ended up residing in those areas with higher or lower levels of percentage of population with a disability under the age of 5 due to other factors.
Demographics Similar to Immigrants from Nicaragua by Disability Age Under 5
In terms of disability age under 5, the demographic groups most similar to Immigrants from Nicaragua are Immigrants from Morocco (1.2%, a difference of 0.0%), Immigrants from Uganda (1.1%, a difference of 0.060%), Indonesian (1.2%, a difference of 0.070%), Nicaraguan (1.1%, a difference of 0.17%), and Dominican (1.1%, a difference of 0.20%).
| Demographics | Rating | Rank | Disability Age Under 5 |
| Mongolians | 96.6 /100 | #96 | Exceptional 1.1% |
| Immigrants from Iraq | 96.5 /100 | #97 | Exceptional 1.1% |
| Immigrants from South Eastern Asia | 96.5 /100 | #98 | Exceptional 1.1% |
| Dominicans | 96.3 /100 | #99 | Exceptional 1.1% |
| Nicaraguans | 96.3 /100 | #100 | Exceptional 1.1% |
| Immigrants from Uganda | 96.1 /100 | #101 | Exceptional 1.1% |
| Immigrants from Morocco | 96.0 /100 | #102 | Exceptional 1.2% |
| Immigrants from Nicaragua | 96.0 /100 | #103 | Exceptional 1.2% |
| Indonesians | 95.9 /100 | #104 | Exceptional 1.2% |
| Immigrants from South Africa | 95.6 /100 | #105 | Exceptional 1.2% |
| Cambodians | 95.4 /100 | #106 | Exceptional 1.2% |
| Immigrants from West Indies | 95.3 /100 | #107 | Exceptional 1.2% |
| Iraqis | 95.1 /100 | #108 | Exceptional 1.2% |
| Immigrants from Panama | 95.0 /100 | #109 | Exceptional 1.2% |
| Immigrants from Lebanon | 95.0 /100 | #110 | Exceptional 1.2% |
Immigrants from Nicaragua Disability Age Under 5 Correlation Summary
| Measurement | Immigrants from Nicaragua Data | Disability Age Under 5 Data |
| Minimum | 0.043% | 0.35% |
| Maximum | 6.5% | 6.9% |
| Range | 6.4% | 6.6% |
| Mean | 2.3% | 1.6% |
| Median | 1.8% | 1.1% |
| Interquartile 25% (IQ1) | 0.91% | 0.76% |
| Interquartile 75% (IQ3) | 3.2% | 2.1% |
| Interquartile Range (IQR) | 2.3% | 1.3% |
| Standard Deviation (Sample) | 1.8% | 1.3% |
| Standard Deviation (Population) | 1.7% | 1.2% |
Correlation Details
| Immigrants from Nicaragua Percentile | Sample Size | Disability Age Under 5 |
[ 0.0% - 0.5% ] 0.043% | 97,469,873 | 0.97% |
[ 0.0% - 0.5% ] 0.14% | 24,536,313 | 1.1% |
[ 0.0% - 0.5% ] 0.23% | 13,848,933 | 0.96% |
[ 0.0% - 0.5% ] 0.33% | 4,421,911 | 1.5% |
[ 0.0% - 0.5% ] 0.43% | 3,683,914 | 1.0% |
[ 0.5% - 1.0% ] 0.52% | 1,492,976 | 1.1% |
[ 0.5% - 1.0% ] 0.62% | 1,404,953 | 1.2% |
[ 0.5% - 1.0% ] 0.72% | 743,435 | 1.1% |
[ 0.5% - 1.0% ] 0.81% | 947,296 | 0.71% |
[ 0.5% - 1.0% ] 0.91% | 529,767 | 1.5% |
[ 1.0% - 1.5% ] 1.02% | 276,540 | 0.90% |
[ 1.0% - 1.5% ] 1.12% | 138,791 | 3.8% |
[ 1.0% - 1.5% ] 1.22% | 360,060 | 1.5% |
[ 1.0% - 1.5% ] 1.29% | 307,069 | 2.3% |
[ 1.0% - 1.5% ] 1.37% | 116,701 | 1.1% |
[ 1.5% - 2.0% ] 1.51% | 207,829 | 0.76% |
[ 1.5% - 2.0% ] 1.58% | 27,033 | 0.69% |
[ 1.5% - 2.0% ] 1.68% | 149,791 | 0.55% |
[ 1.5% - 2.0% ] 1.75% | 29,530 | 0.56% |
[ 1.5% - 2.0% ] 1.84% | 123,698 | 0.35% |
[ 2.0% - 2.5% ] 2.06% | 126,402 | 0.57% |
[ 2.0% - 2.5% ] 2.30% | 2,560 | 6.9% |
[ 2.0% - 2.5% ] 2.39% | 15,379 | 3.3% |
[ 2.0% - 2.5% ] 2.41% | 57,327 | 2.1% |
[ 2.5% - 3.0% ] 2.58% | 48,743 | 0.68% |
[ 2.5% - 3.0% ] 2.89% | 37,958 | 3.1% |
[ 2.5% - 3.0% ] 3.00% | 24,597 | 0.88% |
[ 3.0% - 3.5% ] 3.16% | 37,977 | 0.88% |
[ 3.0% - 3.5% ] 3.23% | 38,392 | 2.3% |
[ 3.0% - 3.5% ] 3.43% | 100,328 | 2.1% |
[ 3.5% - 4.0% ] 3.52% | 222,996 | 0.46% |
[ 3.5% - 4.0% ] 3.87% | 52,851 | 0.56% |
[ 4.5% - 5.0% ] 4.67% | 443,665 | 1.1% |
[ 4.5% - 5.0% ] 4.80% | 46,798 | 1.3% |
[ 5.0% - 5.5% ] 5.11% | 13,163 | 3.4% |
[ 5.5% - 6.0% ] 5.52% | 57,066 | 1.3% |
[ 6.0% - 6.5% ] 6.44% | 34,335 | 1.8% |
[ 6.0% - 6.5% ] 6.47% | 59,121 | 2.6% |