Immigrants from Nicaragua 2 or more Vehicles in Household
COMPARE
Immigrants from Nicaragua
Select to Compare
2 or more Vehicles in Household
Immigrants from Nicaragua 2 or more Vehicles in Household
55.4%
2+ VEHICLES AVAILABLE
51.6/ 100
METRIC RATING
172nd/ 347
METRIC RANK
Immigrants from Nicaragua 2 or more Vehicles in Household Correlation Chart
The statistical analysis conducted on geographies consisting of 236,314,206 people shows a mild positive correlation between the proportion of Immigrants from Nicaragua and percentage of households with 2 or more vehicles available in the United States with a correlation coefficient (R) of 0.339 and weighted average of 55.4%. On average, for every 1% (one percent) increase in Immigrants from Nicaragua within a typical geography, there is an increase of 1.1% in percentage of households with 2 or more vehicles available.
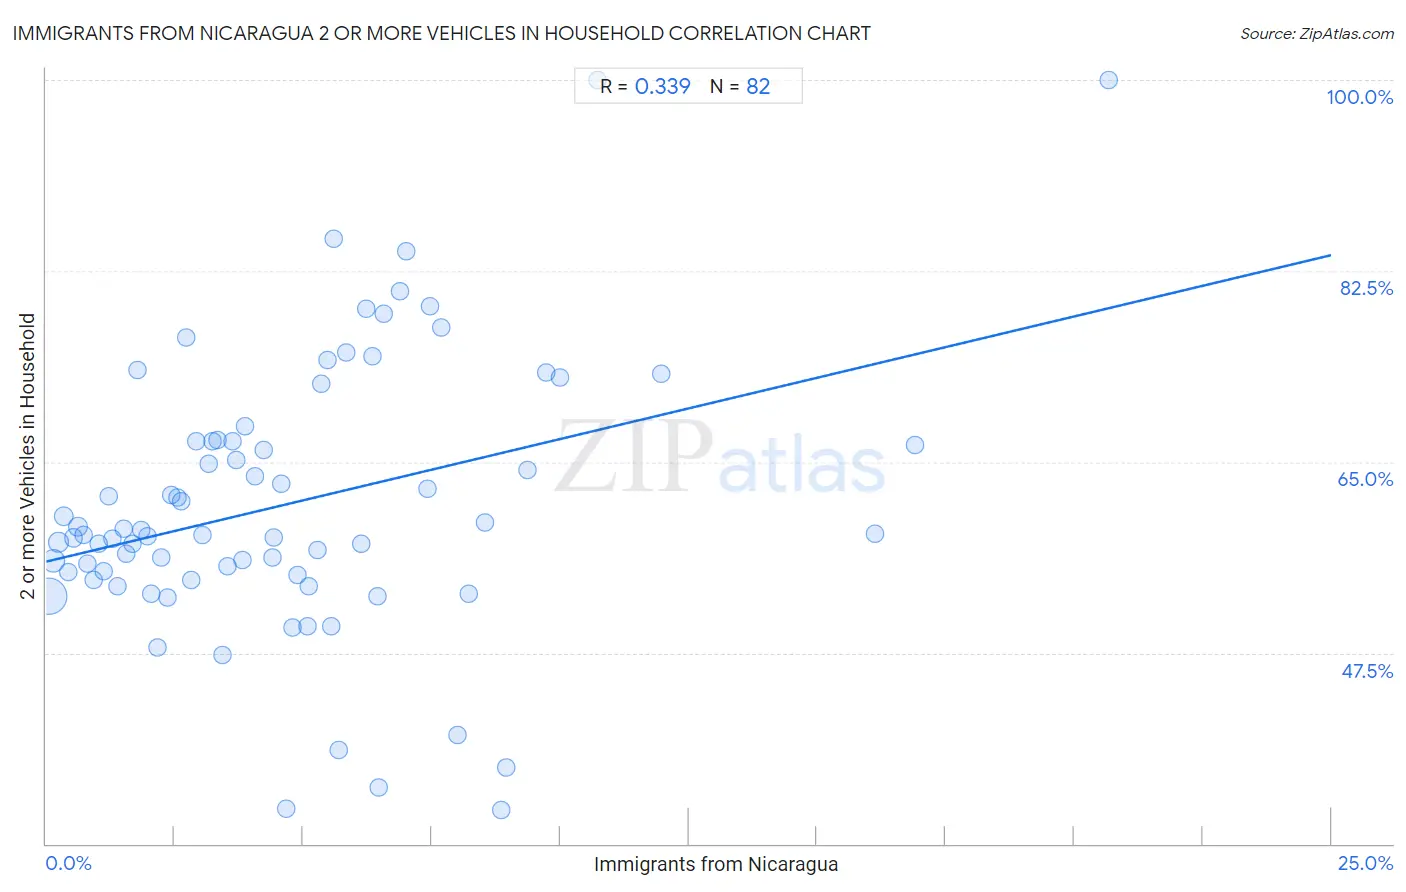
It is essential to understand that the correlation between the percentage of Immigrants from Nicaragua and percentage of households with 2 or more vehicles available does not imply a direct cause-and-effect relationship. It remains uncertain whether the presence of Immigrants from Nicaragua influences an upward or downward trend in the level of percentage of households with 2 or more vehicles available within an area, or if Immigrants from Nicaragua simply ended up residing in those areas with higher or lower levels of percentage of households with 2 or more vehicles available due to other factors.
Demographics Similar to Immigrants from Nicaragua by 2 or more Vehicles in Household
In terms of 2 or more vehicles in household, the demographic groups most similar to Immigrants from Nicaragua are Immigrants from Western Europe (55.4%, a difference of 0.010%), Navajo (55.3%, a difference of 0.070%), Immigrants from Denmark (55.3%, a difference of 0.090%), Immigrants from Costa Rica (55.4%, a difference of 0.11%), and Romanian (55.5%, a difference of 0.17%).
| Demographics | Rating | Rank | 2 or more Vehicles in Household |
| Immigrants from El Salvador | 59.4 /100 | #165 | Average 55.6% |
| Immigrants from Sri Lanka | 58.3 /100 | #166 | Average 55.5% |
| Kenyans | 58.1 /100 | #167 | Average 55.5% |
| French American Indians | 56.7 /100 | #168 | Average 55.5% |
| Immigrants from Austria | 56.3 /100 | #169 | Average 55.5% |
| Romanians | 55.8 /100 | #170 | Average 55.5% |
| Immigrants from Costa Rica | 54.4 /100 | #171 | Average 55.4% |
| Immigrants from Nicaragua | 51.6 /100 | #172 | Average 55.4% |
| Immigrants from Western Europe | 51.4 /100 | #173 | Average 55.4% |
| Navajo | 50.0 /100 | #174 | Average 55.3% |
| Immigrants from Denmark | 49.4 /100 | #175 | Average 55.3% |
| Immigrants from Cuba | 47.0 /100 | #176 | Average 55.3% |
| Menominee | 46.2 /100 | #177 | Average 55.3% |
| Immigrants from Sweden | 45.3 /100 | #178 | Average 55.2% |
| Alaskan Athabascans | 42.9 /100 | #179 | Average 55.2% |
Immigrants from Nicaragua 2 or more Vehicles in Household Correlation Summary
| Measurement | Immigrants from Nicaragua Data | 2 or more Vehicles in Household Data |
| Minimum | 0.043% | 33.1% |
| Maximum | 20.7% | 100.0% |
| Range | 20.6% | 66.9% |
| Mean | 4.7% | 61.2% |
| Median | 4.0% | 58.4% |
| Interquartile 25% (IQ1) | 2.0% | 54.6% |
| Interquartile 75% (IQ3) | 6.4% | 66.9% |
| Interquartile Range (IQR) | 4.5% | 12.3% |
| Standard Deviation (Sample) | 3.8% | 12.7% |
| Standard Deviation (Population) | 3.8% | 12.6% |
Correlation Details
| Immigrants from Nicaragua Percentile | Sample Size | 2 or more Vehicles in Household |
[ 0.0% - 0.5% ] 0.043% | 137,854,631 | 52.6% |
[ 0.0% - 0.5% ] 0.14% | 42,569,169 | 55.9% |
[ 0.0% - 0.5% ] 0.23% | 22,016,134 | 57.6% |
[ 0.0% - 0.5% ] 0.33% | 9,309,485 | 60.0% |
[ 0.0% - 0.5% ] 0.43% | 6,563,063 | 54.9% |
[ 0.5% - 1.0% ] 0.52% | 3,482,575 | 58.0% |
[ 0.5% - 1.0% ] 0.62% | 2,788,859 | 59.1% |
[ 0.5% - 1.0% ] 0.72% | 1,656,770 | 58.3% |
[ 0.5% - 1.0% ] 0.81% | 1,762,520 | 55.7% |
[ 0.5% - 1.0% ] 0.91% | 970,008 | 54.2% |
[ 1.0% - 1.5% ] 1.01% | 680,913 | 57.5% |
[ 1.0% - 1.5% ] 1.12% | 611,167 | 55.0% |
[ 1.0% - 1.5% ] 1.21% | 501,792 | 61.8% |
[ 1.0% - 1.5% ] 1.30% | 498,553 | 58.0% |
[ 1.0% - 1.5% ] 1.38% | 294,776 | 53.6% |
[ 1.0% - 1.5% ] 1.50% | 469,564 | 58.8% |
[ 1.5% - 2.0% ] 1.56% | 264,687 | 56.5% |
[ 1.5% - 2.0% ] 1.68% | 301,897 | 57.5% |
[ 1.5% - 2.0% ] 1.77% | 39,282 | 73.4% |
[ 1.5% - 2.0% ] 1.85% | 215,724 | 58.7% |
[ 1.5% - 2.0% ] 1.98% | 60,301 | 58.2% |
[ 2.0% - 2.5% ] 2.05% | 267,160 | 52.9% |
[ 2.0% - 2.5% ] 2.17% | 29,198 | 48.0% |
[ 2.0% - 2.5% ] 2.23% | 59,190 | 56.2% |
[ 2.0% - 2.5% ] 2.35% | 44,312 | 52.6% |
[ 2.0% - 2.5% ] 2.42% | 248,977 | 61.9% |
[ 2.5% - 3.0% ] 2.55% | 173,321 | 61.7% |
[ 2.5% - 3.0% ] 2.62% | 67,641 | 61.4% |
[ 2.5% - 3.0% ] 2.72% | 55,241 | 76.4% |
[ 2.5% - 3.0% ] 2.82% | 23,394 | 54.2% |
[ 2.5% - 3.0% ] 2.92% | 104,866 | 66.9% |
[ 3.0% - 3.5% ] 3.03% | 142,707 | 58.3% |
[ 3.0% - 3.5% ] 3.16% | 133,929 | 64.8% |
[ 3.0% - 3.5% ] 3.23% | 118,950 | 66.9% |
[ 3.0% - 3.5% ] 3.33% | 21,667 | 67.0% |
[ 3.0% - 3.5% ] 3.43% | 176,909 | 47.3% |
[ 3.5% - 4.0% ] 3.52% | 226,831 | 55.4% |
[ 3.5% - 4.0% ] 3.64% | 4,209 | 66.9% |
[ 3.5% - 4.0% ] 3.69% | 96,536 | 65.2% |
[ 3.5% - 4.0% ] 3.81% | 4,987 | 56.0% |
[ 3.5% - 4.0% ] 3.87% | 80,755 | 68.3% |
[ 4.0% - 4.5% ] 4.06% | 60,592 | 63.6% |
[ 4.0% - 4.5% ] 4.24% | 50,106 | 66.1% |
[ 4.0% - 4.5% ] 4.40% | 44,062 | 56.2% |
[ 4.0% - 4.5% ] 4.44% | 496 | 58.0% |
[ 4.5% - 5.0% ] 4.58% | 63,650 | 63.0% |
[ 4.5% - 5.0% ] 4.67% | 444,748 | 33.2% |
[ 4.5% - 5.0% ] 4.80% | 49,347 | 49.8% |
[ 4.5% - 5.0% ] 4.88% | 105,852 | 54.6% |
[ 5.0% - 5.5% ] 5.09% | 47,065 | 50.0% |
[ 5.0% - 5.5% ] 5.11% | 30,980 | 53.6% |
[ 5.0% - 5.5% ] 5.28% | 45,620 | 57.0% |
[ 5.0% - 5.5% ] 5.36% | 1,979 | 72.2% |
[ 5.0% - 5.5% ] 5.47% | 822 | 74.3% |
[ 5.5% - 6.0% ] 5.54% | 85,736 | 49.9% |
[ 5.5% - 6.0% ] 5.59% | 143 | 85.4% |
[ 5.5% - 6.0% ] 5.69% | 14,698 | 38.6% |
[ 5.5% - 6.0% ] 5.83% | 309 | 75.0% |
[ 6.0% - 6.5% ] 6.14% | 5,049 | 57.5% |
[ 6.0% - 6.5% ] 6.22% | 16,776 | 79.0% |
[ 6.0% - 6.5% ] 6.34% | 867 | 74.7% |
[ 6.0% - 6.5% ] 6.44% | 34,335 | 52.7% |
[ 6.0% - 6.5% ] 6.47% | 59,121 | 35.1% |
[ 6.5% - 7.0% ] 6.56% | 457 | 78.6% |
[ 6.5% - 7.0% ] 6.89% | 740 | 80.7% |
[ 6.5% - 7.0% ] 7.00% | 443 | 84.3% |
[ 7.0% - 7.5% ] 7.41% | 297 | 62.5% |
[ 7.0% - 7.5% ] 7.46% | 469 | 79.2% |
[ 7.5% - 8.0% ] 7.68% | 924 | 77.3% |
[ 8.0% - 8.5% ] 8.00% | 475 | 40.0% |
[ 8.0% - 8.5% ] 8.21% | 1,194 | 52.9% |
[ 8.5% - 9.0% ] 8.53% | 40,278 | 59.5% |
[ 8.5% - 9.0% ] 8.86% | 34,742 | 33.1% |
[ 8.5% - 9.0% ] 8.96% | 54,873 | 37.0% |
[ 9.0% - 9.5% ] 9.36% | 844 | 64.3% |
[ 9.5% - 10.0% ] 9.73% | 514 | 73.2% |
[ 9.5% - 10.0% ] 10.00% | 2,041 | 72.7% |
[ 10.5% - 11.0% ] 10.73% | 289 | 100.0% |
[ 11.5% - 12.0% ] 11.95% | 778 | 73.1% |
[ 16.0% - 16.5% ] 16.11% | 19,399 | 58.4% |
[ 16.5% - 17.0% ] 16.89% | 296 | 66.5% |
[ 20.5% - 21.0% ] 20.67% | 150 | 100.0% |