Immigrants from Egypt 1 or more Vehicles in Household
COMPARE
Immigrants from Egypt
Select to Compare
1 or more Vehicles in Household
Immigrants from Egypt 1 or more Vehicles in Household
87.8%
1+ VEHICLES AVAILABLE
0.5/ 100
METRIC RATING
263rd/ 347
METRIC RANK
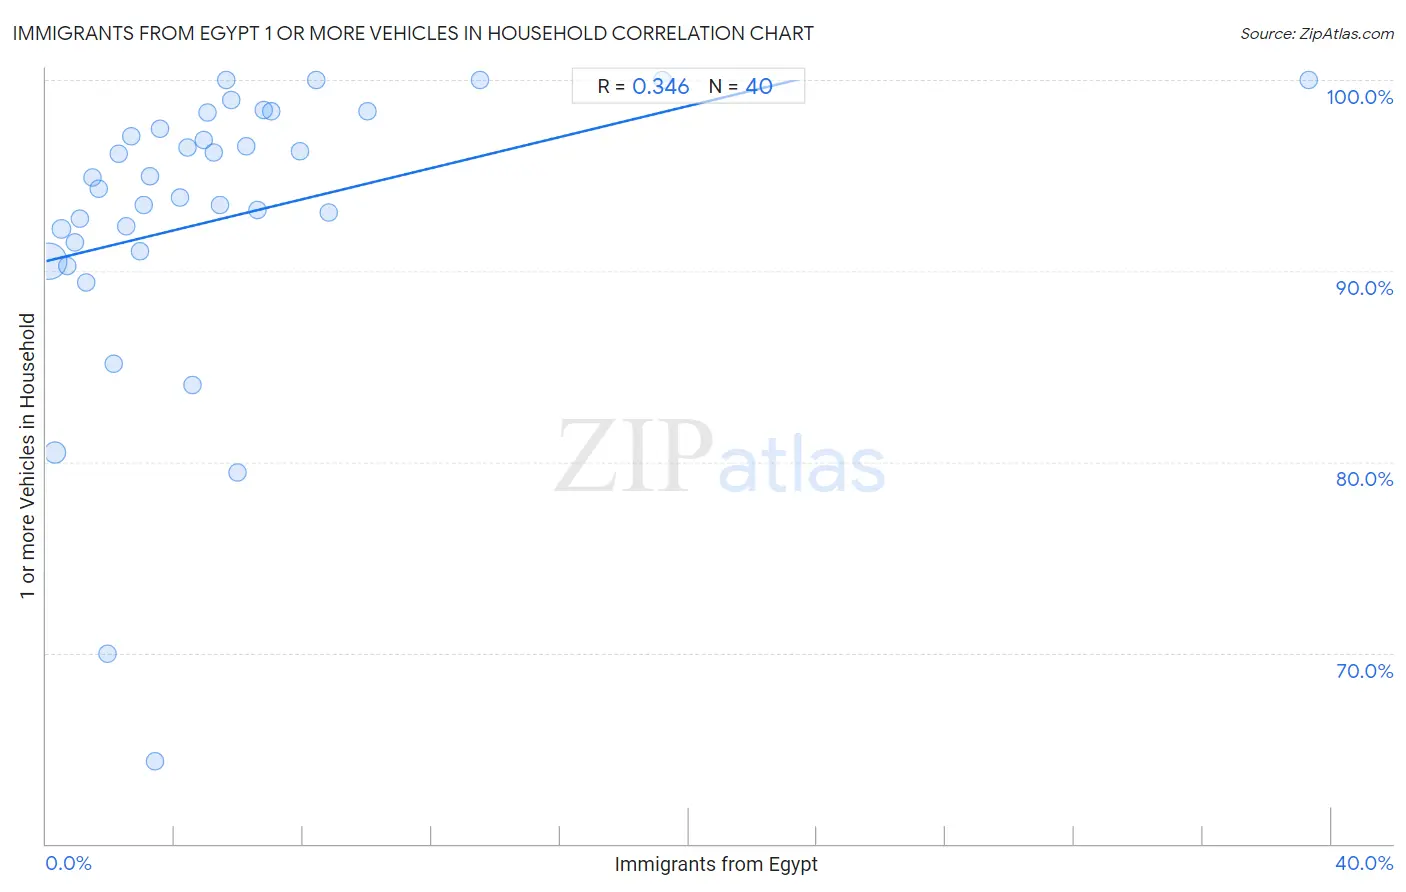
Immigrants from Egypt 1 or more Vehicles in Household Correlation Chart
The statistical analysis conducted on geographies consisting of 245,380,882 people shows a mild positive correlation between the proportion of Immigrants from Egypt and percentage of households with 1 or more vehicles available in the United States with a correlation coefficient (R) of 0.346 and weighted average of 87.8%. On average, for every 1% (one percent) increase in Immigrants from Egypt within a typical geography, there is an increase of 0.41% in percentage of households with 1 or more vehicles available.
It is essential to understand that the correlation between the percentage of Immigrants from Egypt and percentage of households with 1 or more vehicles available does not imply a direct cause-and-effect relationship. It remains uncertain whether the presence of Immigrants from Egypt influences an upward or downward trend in the level of percentage of households with 1 or more vehicles available within an area, or if Immigrants from Egypt simply ended up residing in those areas with higher or lower levels of percentage of households with 1 or more vehicles available due to other factors.
Demographics Similar to Immigrants from Egypt by 1 or more Vehicles in Household
In terms of 1 or more vehicles in household, the demographic groups most similar to Immigrants from Egypt are Immigrants from Liberia (87.8%, a difference of 0.010%), African (87.8%, a difference of 0.040%), Subsaharan African (87.9%, a difference of 0.070%), Immigrants from Switzerland (87.9%, a difference of 0.10%), and Macedonian (87.9%, a difference of 0.14%).
| Demographics | Rating | Rank | 1 or more Vehicles in Household |
| Colombians | 0.9 /100 | #256 | Tragic 88.0% |
| Liberians | 0.9 /100 | #257 | Tragic 88.0% |
| South American Indians | 0.9 /100 | #258 | Tragic 88.0% |
| Nigerians | 0.8 /100 | #259 | Tragic 88.0% |
| Macedonians | 0.6 /100 | #260 | Tragic 87.9% |
| Immigrants from Switzerland | 0.6 /100 | #261 | Tragic 87.9% |
| Sub-Saharan Africans | 0.5 /100 | #262 | Tragic 87.9% |
| Immigrants from Egypt | 0.5 /100 | #263 | Tragic 87.8% |
| Immigrants from Liberia | 0.4 /100 | #264 | Tragic 87.8% |
| Africans | 0.4 /100 | #265 | Tragic 87.8% |
| Israelis | 0.3 /100 | #266 | Tragic 87.7% |
| Immigrants from Colombia | 0.3 /100 | #267 | Tragic 87.6% |
| Immigrants from Europe | 0.2 /100 | #268 | Tragic 87.6% |
| Immigrants from Africa | 0.2 /100 | #269 | Tragic 87.6% |
| Panamanians | 0.2 /100 | #270 | Tragic 87.5% |
Immigrants from Egypt 1 or more Vehicles in Household Correlation Summary
| Measurement | Immigrants from Egypt Data | 1 or more Vehicles in Household Data |
| Minimum | 0.064% | 64.3% |
| Maximum | 39.3% | 100.0% |
| Range | 39.2% | 35.7% |
| Mean | 5.5% | 92.7% |
| Median | 4.3% | 94.6% |
| Interquartile 25% (IQ1) | 2.0% | 91.3% |
| Interquartile 75% (IQ3) | 6.4% | 97.9% |
| Interquartile Range (IQR) | 4.4% | 6.6% |
| Standard Deviation (Sample) | 6.6% | 7.8% |
| Standard Deviation (Population) | 6.6% | 7.7% |
Correlation Details
| Immigrants from Egypt Percentile | Sample Size | 1 or more Vehicles in Household |
[ 0.0% - 0.5% ] 0.064% | 186,636,263 | 90.5% |
[ 0.0% - 0.5% ] 0.27% | 37,102,844 | 80.5% |
[ 0.0% - 0.5% ] 0.48% | 9,160,043 | 92.2% |
[ 0.5% - 1.0% ] 0.66% | 4,509,042 | 90.3% |
[ 0.5% - 1.0% ] 0.89% | 2,435,569 | 91.5% |
[ 1.0% - 1.5% ] 1.05% | 2,231,028 | 92.8% |
[ 1.0% - 1.5% ] 1.26% | 877,617 | 89.4% |
[ 1.0% - 1.5% ] 1.45% | 473,381 | 94.9% |
[ 1.5% - 2.0% ] 1.63% | 523,491 | 94.3% |
[ 1.5% - 2.0% ] 1.91% | 497,177 | 70.0% |
[ 2.0% - 2.5% ] 2.10% | 267,767 | 85.1% |
[ 2.0% - 2.5% ] 2.25% | 46,634 | 96.2% |
[ 2.0% - 2.5% ] 2.49% | 58,974 | 92.4% |
[ 2.5% - 3.0% ] 2.63% | 53,753 | 97.0% |
[ 2.5% - 3.0% ] 2.93% | 5,250 | 91.0% |
[ 3.0% - 3.5% ] 3.05% | 25,401 | 93.5% |
[ 3.0% - 3.5% ] 3.22% | 51,883 | 95.0% |
[ 3.0% - 3.5% ] 3.38% | 66,906 | 64.3% |
[ 3.5% - 4.0% ] 3.54% | 6,238 | 97.4% |
[ 4.0% - 4.5% ] 4.17% | 30,450 | 93.8% |
[ 4.0% - 4.5% ] 4.41% | 12,424 | 96.4% |
[ 4.5% - 5.0% ] 4.55% | 1,429 | 84.0% |
[ 4.5% - 5.0% ] 4.89% | 99,800 | 96.9% |
[ 5.0% - 5.5% ] 5.04% | 22,925 | 98.3% |
[ 5.0% - 5.5% ] 5.21% | 8,410 | 96.2% |
[ 5.0% - 5.5% ] 5.40% | 2,815 | 93.4% |
[ 5.5% - 6.0% ] 5.59% | 161 | 100.0% |
[ 5.5% - 6.0% ] 5.76% | 747 | 98.9% |
[ 5.5% - 6.0% ] 5.97% | 141,145 | 79.4% |
[ 6.0% - 6.5% ] 6.22% | 8,815 | 96.5% |
[ 6.5% - 7.0% ] 6.58% | 5,000 | 93.2% |
[ 6.5% - 7.0% ] 6.76% | 148 | 98.5% |
[ 6.5% - 7.0% ] 6.99% | 143 | 98.4% |
[ 7.5% - 8.0% ] 7.90% | 6,938 | 96.3% |
[ 8.0% - 8.5% ] 8.40% | 750 | 100.0% |
[ 8.5% - 9.0% ] 8.81% | 1,339 | 93.1% |
[ 10.0% - 10.5% ] 10.02% | 5,751 | 98.4% |
[ 13.0% - 13.5% ] 13.49% | 1,394 | 100.0% |
[ 19.0% - 19.5% ] 19.16% | 981 | 100.0% |
[ 39.0% - 39.5% ] 39.29% | 56 | 100.0% |