Immigrants from Egypt GED/Equivalency

COMPARE

Immigrants from Egypt
Race
Ancestry
AfghanAfricanAlaska NativeAlaskan AthabascanAlbanianAleutAlsatianAmericanApacheArabArapahoArgentineanArmenianAssyrian/Chaldean/SyriacAustralianAustrianBahamianBangladeshiBarbadianBasqueBelgianBelizeanBermudanBhutaneseBlackfeetBolivianBrazilianBritishBritish West IndianBulgarianBurmeseCajunCambodianCanadianCape VerdeanCarpatho RusynCelticCentral AmericanCentral American IndianCherokeeCheyenneChickasawChileanChineseChippewaChoctawColombianColvilleComancheCosta RicanCreeCreekCroatianCrowCubanCypriotCzechCzechoslovakianDanishDelawareDominicanDutchDutch West IndianEastern EuropeanEcuadorianEgyptianEnglishEstonianEthiopianEuropeanFijianFilipinoFinnishFrenchFrench American IndianFrench CanadianGermanGerman RussianGhanaianGreekGuamanian/ChamorroGuatemalanGuyaneseHaitianHmongHonduranHopiHoumaHungarianIcelanderIndian (Asian)IndonesianInupiatIranianIraqiIrishIroquoisIsraeliItalianJamaicanJapaneseJordanianKenyanKiowaKoreanLaotianLatvianLebaneseLiberianLithuanianLumbeeLuxembourgerMacedonianMalaysianMalteseMarshalleseMenomineeMexicanMexican American IndianMongolianMoroccanNative HawaiianNavajoNepaleseNew ZealanderNicaraguanNigerianNorthern EuropeanNorwegianOkinawanOsageOttawaPaiutePakistaniPalestinianPanamanianParaguayanPennsylvania GermanPeruvianPimaPolishPortuguesePotawatomiPuebloPuerto RicanPuget Sound SalishRomanianRussianSalvadoranSamoanScandinavianScotch-IrishScottishSeminoleSenegaleseSerbianShoshoneSierra LeoneanSiouxSlavicSlovakSloveneSomaliSouth AfricanSouth AmericanSouth American IndianSoviet UnionSpaniardSpanishSpanish AmericanSpanish American IndianSri LankanSubsaharan AfricanSudaneseSwedishSwissSyrianTaiwaneseThaiTlingit-HaidaTohono O'OdhamTonganTrinidadian and TobagonianTsimshianTurkishU.S. Virgin IslanderUgandanUkrainianUruguayanUteVenezuelanVietnameseWelshWest IndianYakamaYaquiYugoslavianYumanYup'ikZimbabwean
Immigration
NonimmigrantsImmigrantsAfghanistanAfricaAlbaniaArgentinaArmeniaAsiaAustraliaAustriaBahamasBangladeshBarbadosBelarusBelgiumBelizeBoliviaBosnia and HerzegovinaBrazilBulgariaBurma/MyanmarCabo VerdeCambodiaCameroonCanadaCaribbeanCentral AmericaChileChinaColombiaCongoCosta RicaCroatiaCubaCzechoslovakiaDenmarkDominicaDominican RepublicEastern AfricaEastern AsiaEastern EuropeEcuadorEgyptEl SalvadorEnglandEritreaEthiopiaEuropeFijiFranceGermanyGhanaGreeceGrenadaGuatemalaGuyanaHaitiHondurasHong KongHungaryIndiaIndonesiaIranIraqIrelandIsraelItalyJamaicaJapanJordanKazakhstanKenyaKoreaKuwaitLaosLatin AmericaLatviaLebanonLiberiaLithuaniaMalaysiaMexicoMicronesiaMiddle AfricaMoldovaMoroccoNepalNetherlandsNicaraguaNigeriaNorth AmericaNorth MacedoniaNorthern AfricaNorthern EuropeNorwayOceaniaPakistanPanamaPeruPhilippinesPolandPortugalRomaniaRussiaSaudi ArabiaScotlandSenegalSerbiaSierra LeoneSingaporeSomaliaSouth AfricaSouth AmericaSouth Central AsiaSouth Eastern AsiaSouthern EuropeSpainSri LankaSt. Vincent and the GrenadinesSudanSwedenSwitzerlandSyriaTaiwanThailandTrinidad and TobagoTurkeyUgandaUkraineUruguayUzbekistanVenezuelaVietnamWest IndiesWestern AfricaWestern AsiaWestern EuropeYemenZaireZimbabweAzores
Select to Compare
Race
Ancestry
AfghanAfricanAlaska NativeAlaskan AthabascanAlbanianAleutAlsatianAmericanApacheArabArapahoArgentineanArmenianAssyrian/Chaldean/SyriacAustralianAustrianBahamianBangladeshiBarbadianBasqueBelgianBelizeanBermudanBhutaneseBlackfeetBolivianBrazilianBritishBritish West IndianBulgarianBurmeseCajunCambodianCanadianCape VerdeanCarpatho RusynCelticCentral AmericanCentral American IndianCherokeeCheyenneChickasawChileanChineseChippewaChoctawColombianColvilleComancheCosta RicanCreeCreekCroatianCrowCubanCypriotCzechCzechoslovakianDanishDelawareDominicanDutchDutch West IndianEastern EuropeanEcuadorianEgyptianEnglishEstonianEthiopianEuropeanFijianFilipinoFinnishFrenchFrench American IndianFrench CanadianGermanGerman RussianGhanaianGreekGuamanian/ChamorroGuatemalanGuyaneseHaitianHmongHonduranHopiHoumaHungarianIcelanderIndian (Asian)IndonesianInupiatIranianIraqiIrishIroquoisIsraeliItalianJamaicanJapaneseJordanianKenyanKiowaKoreanLaotianLatvianLebaneseLiberianLithuanianLumbeeLuxembourgerMacedonianMalaysianMalteseMarshalleseMenomineeMexicanMexican American IndianMongolianMoroccanNative HawaiianNavajoNepaleseNew ZealanderNicaraguanNigerianNorthern EuropeanNorwegianOkinawanOsageOttawaPaiutePakistaniPalestinianPanamanianParaguayanPennsylvania GermanPeruvianPimaPolishPortuguesePotawatomiPuebloPuerto RicanPuget Sound SalishRomanianRussianSalvadoranSamoanScandinavianScotch-IrishScottishSeminoleSenegaleseSerbianShoshoneSierra LeoneanSiouxSlavicSlovakSloveneSomaliSouth AfricanSouth AmericanSouth American IndianSoviet UnionSpaniardSpanishSpanish AmericanSpanish American IndianSri LankanSubsaharan AfricanSudaneseSwedishSwissSyrianTaiwaneseThaiTlingit-HaidaTohono O'OdhamTonganTrinidadian and TobagonianTsimshianTurkishU.S. Virgin IslanderUgandanUkrainianUruguayanUteVenezuelanVietnameseWelshWest IndianYakamaYaquiYugoslavianYumanYup'ikZimbabwean
Immigration
NonimmigrantsImmigrantsAfghanistanAfricaAlbaniaArgentinaArmeniaAsiaAustraliaAustriaBahamasBangladeshBarbadosBelarusBelgiumBelizeBoliviaBosnia and HerzegovinaBrazilBulgariaBurma/MyanmarCabo VerdeCambodiaCameroonCanadaCaribbeanCentral AmericaChileChinaColombiaCongoCosta RicaCroatiaCubaCzechoslovakiaDenmarkDominicaDominican RepublicEastern AfricaEastern AsiaEastern EuropeEcuadorEl SalvadorEnglandEritreaEthiopiaEuropeFijiFranceGermanyGhanaGreeceGrenadaGuatemalaGuyanaHaitiHondurasHong KongHungaryIndiaIndonesiaIranIraqIrelandIsraelItalyJamaicaJapanJordanKazakhstanKenyaKoreaKuwaitLaosLatin AmericaLatviaLebanonLiberiaLithuaniaMalaysiaMexicoMicronesiaMiddle AfricaMoldovaMoroccoNepalNetherlandsNicaraguaNigeriaNorth AmericaNorth MacedoniaNorthern AfricaNorthern EuropeNorwayOceaniaPakistanPanamaPeruPhilippinesPolandPortugalRomaniaRussiaSaudi ArabiaScotlandSenegalSerbiaSierra LeoneSingaporeSomaliaSouth AfricaSouth AmericaSouth Central AsiaSouth Eastern AsiaSouthern EuropeSpainSri LankaSt. Vincent and the GrenadinesSudanSwedenSwitzerlandSyriaTaiwanThailandTrinidad and TobagoTurkeyUgandaUkraineUruguayUzbekistanVenezuelaVietnamWest IndiesWestern AfricaWestern AsiaWestern EuropeYemenZaireZimbabweAzores
GED/Equivalency
Income
Poverty
Unemployment
Labor Participation
Family Structure
Vehicle Availability
Education Level
Disability

Immigrants from Egypt GED/Equivalency
Exceptional

86.7%
GED/EQUIVALENCY
90.4/ 100
METRIC RATING
124th/ 347
METRIC RANK

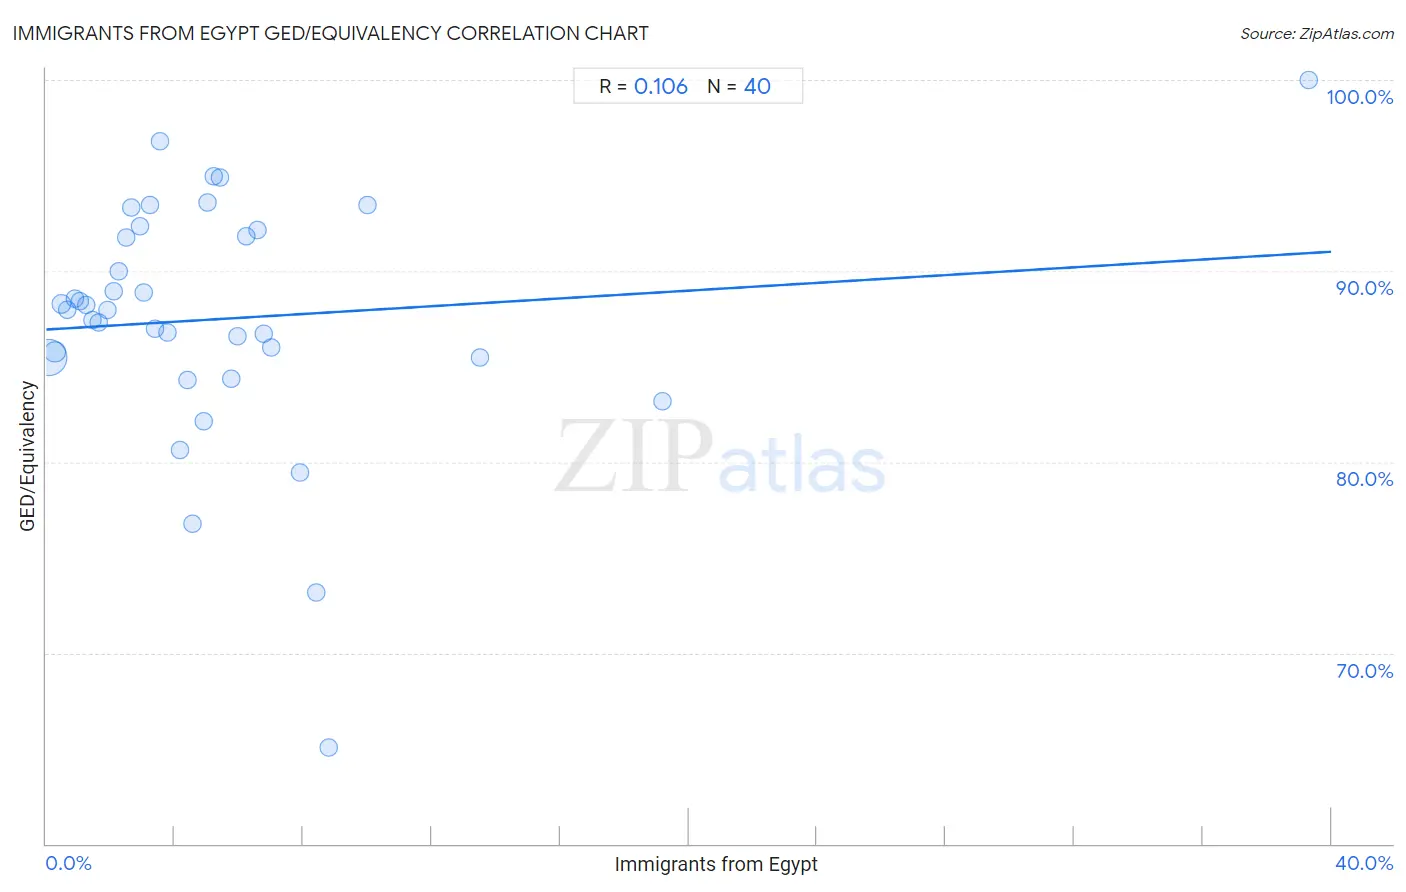
Immigrants from Egypt GED/Equivalency Correlation Chart

The statistical analysis conducted on geographies consisting of 245,485,633 people shows a poor positive correlation between the proportion of Immigrants from Egypt and percentage of population with at least ged/equivalency education in the United States with a correlation coefficient (R) of 0.106 and weighted average of 86.7%. On average, for every 1% (one percent) increase in Immigrants from Egypt within a typical geography, there is an increase of 0.10% in percentage of population with at least ged/equivalency education.
Immigrants from Egypt GED/Equivalency
It is essential to understand that the correlation between the percentage of Immigrants from Egypt and percentage of population with at least ged/equivalency education does not imply a direct cause-and-effect relationship. It remains uncertain whether the presence of Immigrants from Egypt influences an upward or downward trend in the level of percentage of population with at least ged/equivalency education within an area, or if Immigrants from Egypt simply ended up residing in those areas with higher or lower levels of percentage of population with at least ged/equivalency education due to other factors.

Demographics Similar to Immigrants from Egypt by GED/Equivalency

In terms of ged/equivalency, the demographic groups most similar to Immigrants from Egypt are Celtic (86.7%, a difference of 0.0%), Immigrants from Italy (86.7%, a difference of 0.010%), Asian (86.7%, a difference of 0.010%), Immigrants from Lebanon (86.8%, a difference of 0.030%), and Immigrants from Jordan (86.8%, a difference of 0.030%).
DemographicsRating | RankGED/Equivalency
Immigrants from Hong Kong
93.8
/100
|
#117
Exceptional
86.9%
French Canadians
93.2
/100
|
#118
Exceptional
86.9%
Immigrants from China
93.2
/100
|
#119
Exceptional
86.9%
Scotch-Irish
91.6
/100
|
#120
Exceptional
86.8%
Immigrants from Lebanon
90.9
/100
|
#121
Exceptional
86.8%
Immigrants from Jordan
90.8
/100
|
#122
Exceptional
86.8%
Immigrants from Italy
90.5
/100
|
#123
Exceptional
86.7%
Immigrants from Egypt
90.4
/100
|
#124
Exceptional
86.7%
Celtics
90.4
/100
|
#125
Exceptional
86.7%
Asians
90.3
/100
|
#126
Exceptional
86.7%
Argentineans
89.7
/100
|
#127
Excellent
86.7%
Yugoslavians
89.5
/100
|
#128
Excellent
86.7%
Immigrants from Ukraine
88.9
/100
|
#129
Excellent
86.7%
Immigrants from Germany
88.8
/100
|
#130
Excellent
86.7%
Immigrants from Spain
88.5
/100
|
#131
Excellent
86.7%

Immigrants from Egypt GED/Equivalency Correlation Summary

MeasurementImmigrants from Egypt DataGED/Equivalency Data
Minimum0.064%65.1%
Maximum39.3%100.0%
Range39.2%34.9%
Mean5.5%87.5%
Median4.0%88.0%
Interquartile 25% (IQ1)2.0%85.5%
Interquartile 75% (IQ3)6.4%92.0%
Interquartile Range (IQR)4.4%6.5%
Standard Deviation (Sample)6.7%6.4%
Standard Deviation (Population)6.6%6.3%

Correlation Details

Immigrants from Egypt PercentileSample SizeGED/Equivalency
[
0.0%
-
0.5%
]
0.064%
186,666,64385.5%
[
0.0%
-
0.5%
]
0.27%
37,122,23685.8%
[
0.0%
-
0.5%
]
0.48%
9,162,84888.3%
[
0.5%
-
1.0%
]
0.66%
4,509,04288.0%
[
0.5%
-
1.0%
]
0.89%
2,435,56988.6%
[
1.0%
-
1.5%
]
1.05%
2,231,02888.4%
[
1.0%
-
1.5%
]
1.26%
877,61788.2%
[
1.0%
-
1.5%
]
1.45%
473,38187.4%
[
1.5%
-
2.0%
]
1.63%
523,49187.3%
[
1.5%
-
2.0%
]
1.91%
497,50988.0%
[
2.0%
-
2.5%
]
2.10%
267,76789.0%
[
2.0%
-
2.5%
]
2.25%
46,63490.0%
[
2.0%
-
2.5%
]
2.49%
58,97491.8%
[
2.5%
-
3.0%
]
2.63%
53,75393.3%
[
2.5%
-
3.0%
]
2.93%
5,25092.4%
[
3.0%
-
3.5%
]
3.05%
25,40188.9%
[
3.0%
-
3.5%
]
3.22%
51,88393.5%
[
3.0%
-
3.5%
]
3.38%
66,90687.0%
[
3.5%
-
4.0%
]
3.55%
6,82596.8%
[
3.5%
-
4.0%
]
3.78%
51,41686.7%
[
4.0%
-
4.5%
]
4.17%
30,45080.6%
[
4.0%
-
4.5%
]
4.41%
12,42484.3%
[
4.5%
-
5.0%
]
4.55%
1,42976.8%
[
4.5%
-
5.0%
]
4.89%
99,80082.1%
[
5.0%
-
5.5%
]
5.04%
22,92593.6%
[
5.0%
-
5.5%
]
5.21%
8,41095.0%
[
5.0%
-
5.5%
]
5.40%
2,81594.9%
[
5.5%
-
6.0%
]
5.76%
74784.3%
[
5.5%
-
6.0%
]
5.97%
141,14586.6%
[
6.0%
-
6.5%
]
6.22%
8,81591.8%
[
6.5%
-
7.0%
]
6.58%
5,00092.1%
[
6.5%
-
7.0%
]
6.76%
14886.7%
[
6.5%
-
7.0%
]
6.99%
14386.0%
[
7.5%
-
8.0%
]
7.90%
6,93879.5%
[
8.0%
-
8.5%
]
8.40%
75073.1%
[
8.5%
-
9.0%
]
8.81%
1,33965.1%
[
10.0%
-
10.5%
]
10.02%
5,75193.5%
[
13.0%
-
13.5%
]
13.49%
1,39485.5%
[
19.0%
-
19.5%
]
19.16%
98183.2%
[
39.0%
-
39.5%
]
39.29%
56100.0%