Immigrants from Egypt vs Norwegian 4 or more Vehicles in Household
COMPARE
Immigrants from Egypt
Norwegian
4 or more Vehicles in Household
4 or more Vehicles in Household Comparison
Immigrants from Egypt
Norwegians
6.0%
4 OR MORE VEHICLES IN HOUSEHOLD
14.7/ 100
METRIC RATING
212th/ 347
METRIC RANK
8.0%
4 OR MORE VEHICLES IN HOUSEHOLD
100.0/ 100
METRIC RATING
36th/ 347
METRIC RANK
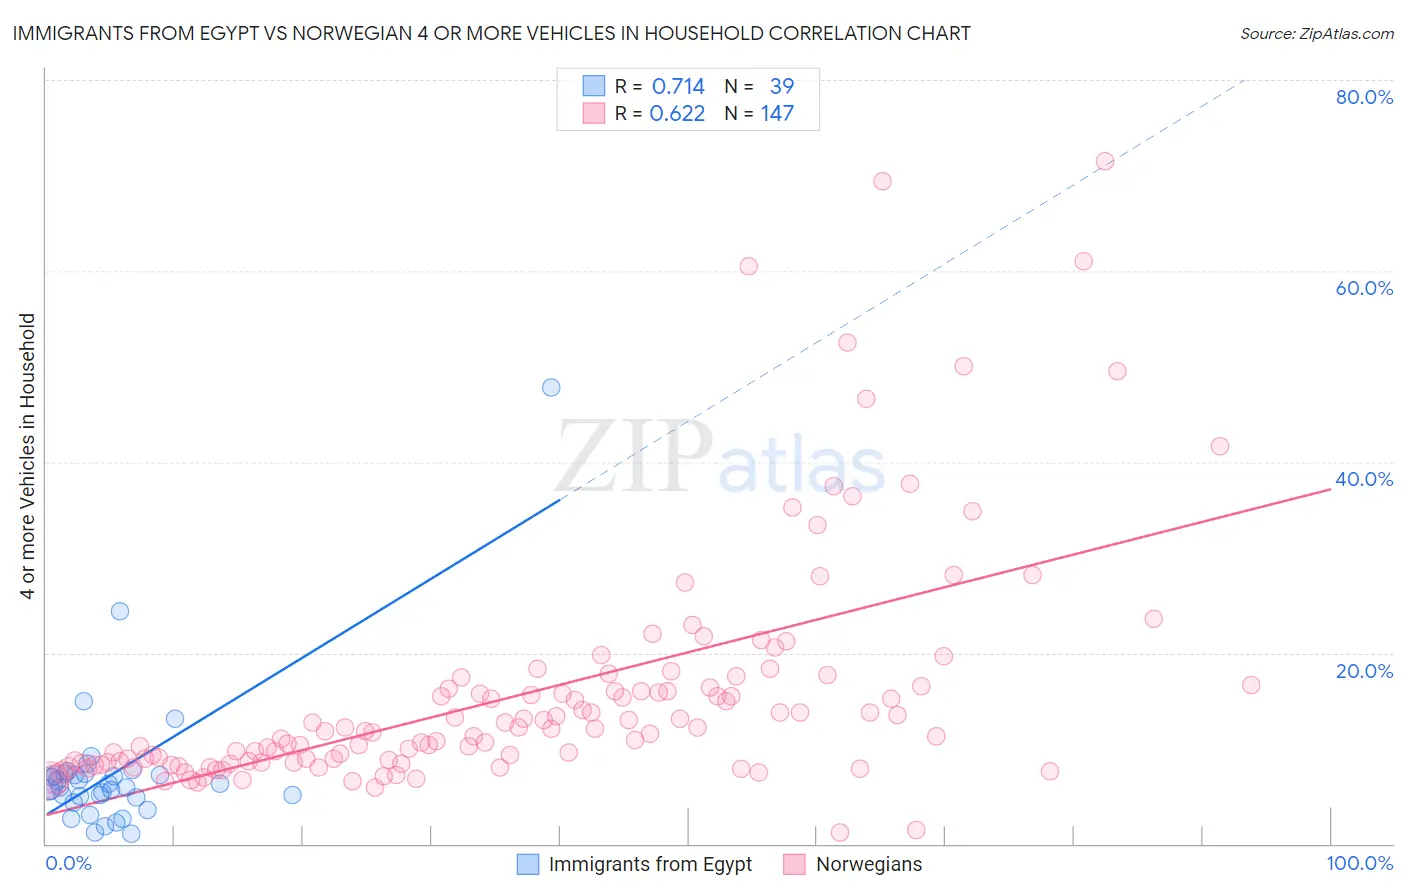
Immigrants from Egypt vs Norwegian 4 or more Vehicles in Household Correlation Chart
The statistical analysis conducted on geographies consisting of 244,625,690 people shows a strong positive correlation between the proportion of Immigrants from Egypt and percentage of households with 4 or more vehicles available in the United States with a correlation coefficient (R) of 0.714 and weighted average of 6.0%. Similarly, the statistical analysis conducted on geographies consisting of 530,553,838 people shows a significant positive correlation between the proportion of Norwegians and percentage of households with 4 or more vehicles available in the United States with a correlation coefficient (R) of 0.622 and weighted average of 8.0%, a difference of 32.3%.
4 or more Vehicles in Household Correlation Summary
| Measurement | Immigrants from Egypt | Norwegian |
| Minimum | 1.1% | 1.2% |
| Maximum | 47.8% | 71.4% |
| Range | 46.7% | 70.2% |
| Mean | 7.5% | 15.8% |
| Median | 6.2% | 11.8% |
| Interquartile 25% (IQ1) | 4.8% | 8.6% |
| Interquartile 75% (IQ3) | 7.3% | 16.5% |
| Interquartile Range (IQR) | 2.5% | 7.9% |
| Standard Deviation (Sample) | 7.8% | 12.5% |
| Standard Deviation (Population) | 7.7% | 12.5% |
Similar Demographics by 4 or more Vehicles in Household
Demographics Similar to Immigrants from Egypt by 4 or more Vehicles in Household
In terms of 4 or more vehicles in household, the demographic groups most similar to Immigrants from Egypt are Panamanian (6.0%, a difference of 0.020%), Arab (6.0%, a difference of 0.060%), Immigrants from Austria (6.0%, a difference of 0.080%), Immigrants from Zimbabwe (6.0%, a difference of 0.10%), and Immigrants from Honduras (6.1%, a difference of 0.15%).
| Demographics | Rating | Rank | 4 or more Vehicles in Household |
| Hondurans | 19.3 /100 | #205 | Poor 6.1% |
| Kenyans | 18.5 /100 | #206 | Poor 6.1% |
| Immigrants | Chile | 16.9 /100 | #207 | Poor 6.1% |
| Immigrants | Nigeria | 15.6 /100 | #208 | Poor 6.1% |
| Immigrants | Honduras | 15.4 /100 | #209 | Poor 6.1% |
| Immigrants | Zimbabwe | 15.1 /100 | #210 | Poor 6.0% |
| Panamanians | 14.8 /100 | #211 | Poor 6.0% |
| Immigrants | Egypt | 14.7 /100 | #212 | Poor 6.0% |
| Arabs | 14.4 /100 | #213 | Poor 6.0% |
| Immigrants | Austria | 14.3 /100 | #214 | Poor 6.0% |
| Immigrants | China | 13.8 /100 | #215 | Poor 6.0% |
| Immigrants | Romania | 13.8 /100 | #216 | Poor 6.0% |
| Nigerians | 12.2 /100 | #217 | Poor 6.0% |
| Immigrants | Italy | 11.0 /100 | #218 | Poor 6.0% |
| Serbians | 11.0 /100 | #219 | Poor 6.0% |
Demographics Similar to Norwegians by 4 or more Vehicles in Household
In terms of 4 or more vehicles in household, the demographic groups most similar to Norwegians are Scandinavian (8.0%, a difference of 0.17%), Sioux (8.0%, a difference of 0.20%), Spanish American (8.0%, a difference of 0.43%), Guamanian/Chamorro (8.1%, a difference of 0.79%), and Alaskan Athabascan (8.1%, a difference of 0.99%).
| Demographics | Rating | Rank | 4 or more Vehicles in Household |
| Immigrants | South Eastern Asia | 100.0 /100 | #29 | Exceptional 8.2% |
| Navajo | 100.0 /100 | #30 | Exceptional 8.2% |
| Natives/Alaskans | 100.0 /100 | #31 | Exceptional 8.2% |
| Marshallese | 100.0 /100 | #32 | Exceptional 8.1% |
| Yaqui | 100.0 /100 | #33 | Exceptional 8.1% |
| Alaskan Athabascans | 100.0 /100 | #34 | Exceptional 8.1% |
| Guamanians/Chamorros | 100.0 /100 | #35 | Exceptional 8.1% |
| Norwegians | 100.0 /100 | #36 | Exceptional 8.0% |
| Scandinavians | 100.0 /100 | #37 | Exceptional 8.0% |
| Sioux | 100.0 /100 | #38 | Exceptional 8.0% |
| Spanish Americans | 100.0 /100 | #39 | Exceptional 8.0% |
| Spanish | 100.0 /100 | #40 | Exceptional 7.9% |
| Pima | 100.0 /100 | #41 | Exceptional 7.9% |
| Salvadorans | 100.0 /100 | #42 | Exceptional 7.8% |
| Fijians | 100.0 /100 | #43 | Exceptional 7.8% |