Immigrants from Egypt Disability Age Under 5
COMPARE
Immigrants from Egypt
Select to Compare
Disability Age Under 5
Immigrants from Egypt Disability Age Under 5
1.1%
DISABILITY | AGE UNDER 5
99.4/ 100
METRIC RATING
58th/ 347
METRIC RANK
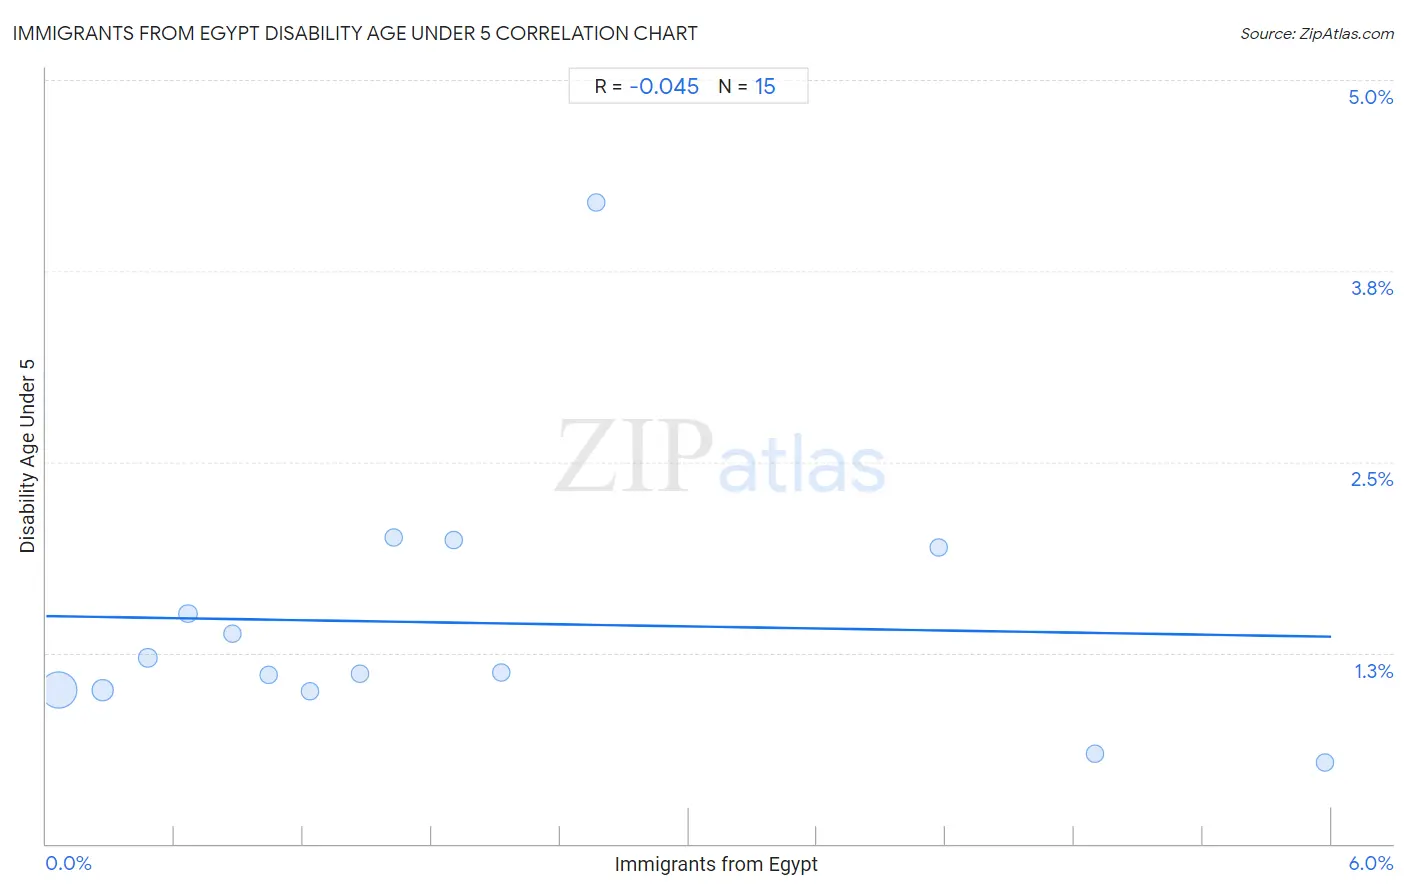
Immigrants from Egypt Disability Age Under 5 Correlation Chart
The statistical analysis conducted on geographies consisting of 152,338,242 people shows no correlation between the proportion of Immigrants from Egypt and percentage of population with a disability under the age of 5 in the United States with a correlation coefficient (R) of -0.045 and weighted average of 1.1%. On average, for every 1% (one percent) increase in Immigrants from Egypt within a typical geography, there is a decrease of 0.023% in percentage of population with a disability under the age of 5.
It is essential to understand that the correlation between the percentage of Immigrants from Egypt and percentage of population with a disability under the age of 5 does not imply a direct cause-and-effect relationship. It remains uncertain whether the presence of Immigrants from Egypt influences an upward or downward trend in the level of percentage of population with a disability under the age of 5 within an area, or if Immigrants from Egypt simply ended up residing in those areas with higher or lower levels of percentage of population with a disability under the age of 5 due to other factors.
Demographics Similar to Immigrants from Egypt by Disability Age Under 5
In terms of disability age under 5, the demographic groups most similar to Immigrants from Egypt are Immigrants from Malaysia (1.1%, a difference of 0.12%), Assyrian/Chaldean/Syriac (1.1%, a difference of 0.19%), Ecuadorian (1.1%, a difference of 0.22%), Salvadoran (1.1%, a difference of 0.61%), and Immigrants from El Salvador (1.1%, a difference of 0.71%).
| Demographics | Rating | Rank | Disability Age Under 5 |
| Immigrants from Kazakhstan | 99.7 /100 | #51 | Exceptional 1.1% |
| Immigrants from Bolivia | 99.6 /100 | #52 | Exceptional 1.1% |
| Asians | 99.6 /100 | #53 | Exceptional 1.1% |
| Immigrants from El Salvador | 99.6 /100 | #54 | Exceptional 1.1% |
| Salvadorans | 99.5 /100 | #55 | Exceptional 1.1% |
| Ecuadorians | 99.5 /100 | #56 | Exceptional 1.1% |
| Assyrians/Chaldeans/Syriacs | 99.5 /100 | #57 | Exceptional 1.1% |
| Immigrants from Egypt | 99.4 /100 | #58 | Exceptional 1.1% |
| Immigrants from Malaysia | 99.4 /100 | #59 | Exceptional 1.1% |
| Immigrants from Western Asia | 99.2 /100 | #60 | Exceptional 1.1% |
| Immigrants from Ethiopia | 99.2 /100 | #61 | Exceptional 1.1% |
| Immigrants from Switzerland | 99.2 /100 | #62 | Exceptional 1.1% |
| Immigrants from Vietnam | 99.1 /100 | #63 | Exceptional 1.1% |
| Egyptians | 98.9 /100 | #64 | Exceptional 1.1% |
| Immigrants from Korea | 98.8 /100 | #65 | Exceptional 1.1% |
Immigrants from Egypt Disability Age Under 5 Correlation Summary
| Measurement | Immigrants from Egypt Data | Disability Age Under 5 Data |
| Minimum | 0.060% | 0.53% |
| Maximum | 6.0% | 4.2% |
| Range | 5.9% | 3.7% |
| Mean | 2.0% | 1.4% |
| Median | 1.5% | 1.1% |
| Interquartile 25% (IQ1) | 0.66% | 1.0% |
| Interquartile 75% (IQ3) | 2.6% | 1.9% |
| Interquartile Range (IQR) | 1.9% | 0.94% |
| Standard Deviation (Sample) | 1.8% | 0.89% |
| Standard Deviation (Population) | 1.7% | 0.86% |
Correlation Details
| Immigrants from Egypt Percentile | Sample Size | Disability Age Under 5 |
[ 0.0% - 0.5% ] 0.060% | 121,241,422 | 1.0% |
[ 0.0% - 0.5% ] 0.26% | 22,019,144 | 1.0% |
[ 0.0% - 0.5% ] 0.47% | 3,927,978 | 1.2% |
[ 0.5% - 1.0% ] 0.66% | 1,869,021 | 1.5% |
[ 0.5% - 1.0% ] 0.87% | 925,970 | 1.4% |
[ 1.0% - 1.5% ] 1.04% | 1,113,295 | 1.1% |
[ 1.0% - 1.5% ] 1.23% | 253,156 | 1.00% |
[ 1.0% - 1.5% ] 1.47% | 173,113 | 1.1% |
[ 1.5% - 2.0% ] 1.62% | 364,887 | 2.0% |
[ 1.5% - 2.0% ] 1.90% | 88,165 | 2.0% |
[ 2.0% - 2.5% ] 2.12% | 69,018 | 1.1% |
[ 2.5% - 3.0% ] 2.57% | 21,829 | 4.2% |
[ 4.0% - 4.5% ] 4.17% | 30,450 | 1.9% |
[ 4.5% - 5.0% ] 4.89% | 99,800 | 0.59% |
[ 5.5% - 6.0% ] 5.97% | 140,994 | 0.53% |