Celtic Disability
COMPARE
Celtic
Select to Compare
Disability
Celtic Disability
13.1%
DISABILITY
0.0/ 100
METRIC RATING
294th/ 347
METRIC RANK
Celtic Disability Correlation Chart
The statistical analysis conducted on geographies consisting of 168,868,984 people shows a moderate positive correlation between the proportion of Celtics and percentage of population with a disability in the United States with a correlation coefficient (R) of 0.423 and weighted average of 13.1%. On average, for every 1% (one percent) increase in Celtics within a typical geography, there is an increase of 0.46% in percentage of population with a disability.
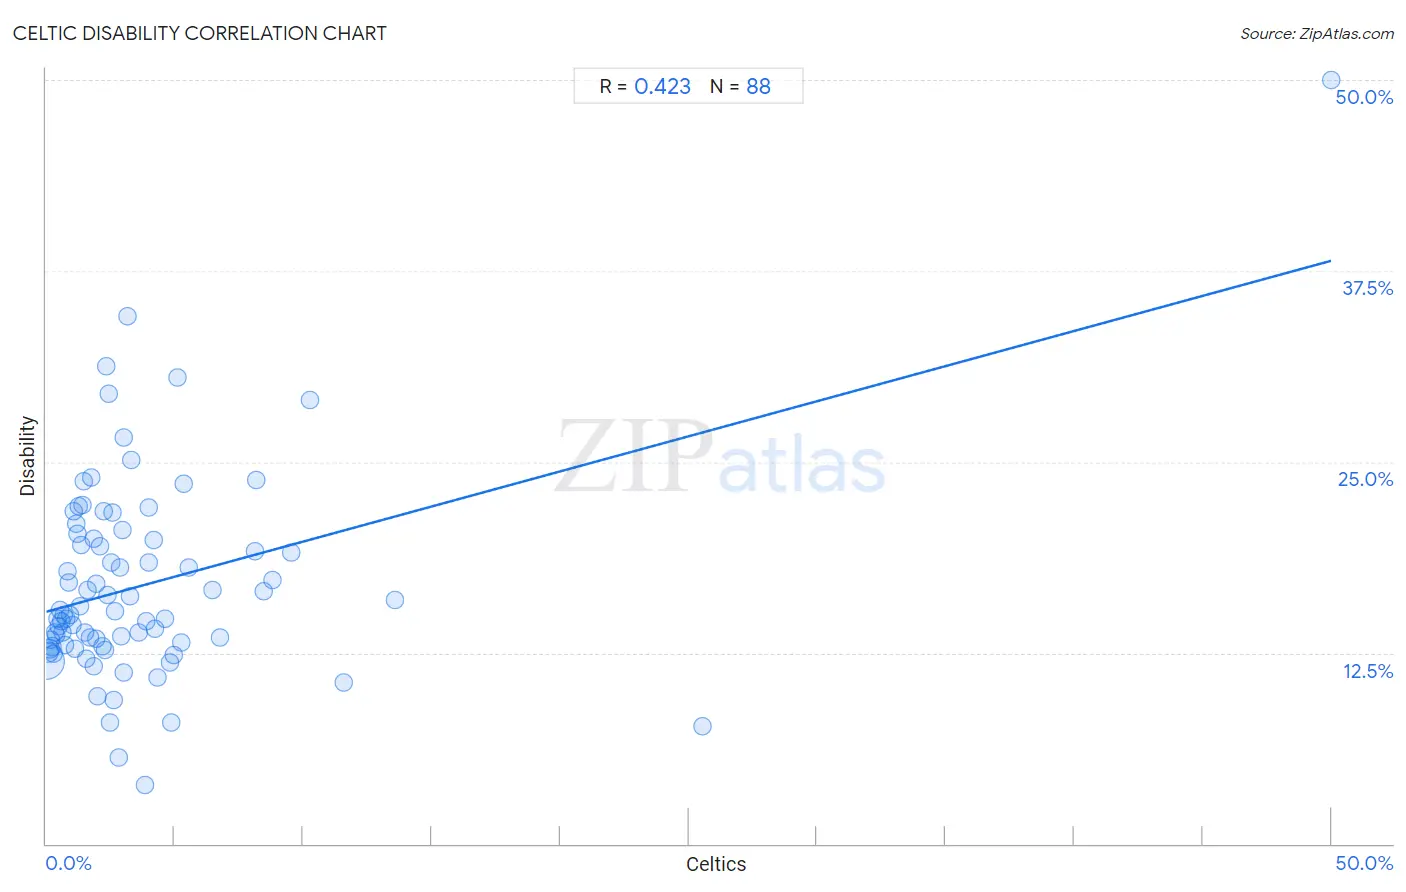
It is essential to understand that the correlation between the percentage of Celtics and percentage of population with a disability does not imply a direct cause-and-effect relationship. It remains uncertain whether the presence of Celtics influences an upward or downward trend in the level of percentage of population with a disability within an area, or if Celtics simply ended up residing in those areas with higher or lower levels of percentage of population with a disability due to other factors.
Demographics Similar to Celtics by Disability
In terms of disability, the demographic groups most similar to Celtics are Nonimmigrants (13.2%, a difference of 0.12%), Central American Indian (13.2%, a difference of 0.16%), Hopi (13.2%, a difference of 0.22%), Alaska Native (13.2%, a difference of 0.23%), and French (13.2%, a difference of 0.25%).
| Demographics | Rating | Rank | Disability |
| Africans | 0.0 /100 | #287 | Tragic 13.0% |
| Whites/Caucasians | 0.0 /100 | #288 | Tragic 13.0% |
| Slovaks | 0.0 /100 | #289 | Tragic 13.0% |
| Cheyenne | 0.0 /100 | #290 | Tragic 13.0% |
| Yaqui | 0.0 /100 | #291 | Tragic 13.1% |
| Aleuts | 0.0 /100 | #292 | Tragic 13.1% |
| Marshallese | 0.0 /100 | #293 | Tragic 13.1% |
| Celtics | 0.0 /100 | #294 | Tragic 13.1% |
| Nonimmigrants | 0.0 /100 | #295 | Tragic 13.2% |
| Central American Indians | 0.0 /100 | #296 | Tragic 13.2% |
| Hopi | 0.0 /100 | #297 | Tragic 13.2% |
| Alaska Natives | 0.0 /100 | #298 | Tragic 13.2% |
| French | 0.0 /100 | #299 | Tragic 13.2% |
| Pennsylvania Germans | 0.0 /100 | #300 | Tragic 13.2% |
| Immigrants from Micronesia | 0.0 /100 | #301 | Tragic 13.2% |
Celtic Disability Correlation Summary
| Measurement | Celtic Data | Disability Data |
| Minimum | 0.018% | 3.8% |
| Maximum | 50.0% | 50.0% |
| Range | 50.0% | 46.2% |
| Mean | 3.8% | 16.9% |
| Median | 2.4% | 15.1% |
| Interquartile 25% (IQ1) | 1.1% | 13.0% |
| Interquartile 75% (IQ3) | 4.2% | 19.9% |
| Interquartile Range (IQR) | 3.1% | 6.9% |
| Standard Deviation (Sample) | 6.2% | 6.7% |
| Standard Deviation (Population) | 6.1% | 6.7% |
Correlation Details
| Celtic Percentile | Sample Size | Disability |
[ 0.0% - 0.5% ] 0.018% | 128,364,253 | 12.0% |
[ 0.0% - 0.5% ] 0.071% | 22,462,117 | 12.5% |
[ 0.0% - 0.5% ] 0.12% | 8,185,215 | 12.8% |
[ 0.0% - 0.5% ] 0.18% | 3,387,918 | 13.4% |
[ 0.0% - 0.5% ] 0.23% | 2,195,396 | 12.9% |
[ 0.0% - 0.5% ] 0.28% | 1,329,627 | 12.4% |
[ 0.0% - 0.5% ] 0.33% | 584,043 | 13.9% |
[ 0.0% - 0.5% ] 0.39% | 409,327 | 13.6% |
[ 0.0% - 0.5% ] 0.44% | 192,767 | 14.7% |
[ 0.0% - 0.5% ] 0.49% | 260,088 | 14.2% |
[ 0.5% - 1.0% ] 0.54% | 206,059 | 15.3% |
[ 0.5% - 1.0% ] 0.59% | 129,384 | 14.6% |
[ 0.5% - 1.0% ] 0.65% | 223,409 | 13.8% |
[ 0.5% - 1.0% ] 0.70% | 98,770 | 15.0% |
[ 0.5% - 1.0% ] 0.73% | 116,482 | 13.0% |
[ 0.5% - 1.0% ] 0.79% | 203,109 | 14.7% |
[ 0.5% - 1.0% ] 0.85% | 41,516 | 17.9% |
[ 0.5% - 1.0% ] 0.89% | 23,937 | 17.1% |
[ 0.5% - 1.0% ] 0.94% | 71,295 | 15.0% |
[ 1.0% - 1.5% ] 1.01% | 25,649 | 14.3% |
[ 1.0% - 1.5% ] 1.06% | 11,331 | 21.8% |
[ 1.0% - 1.5% ] 1.11% | 32,648 | 12.8% |
[ 1.0% - 1.5% ] 1.15% | 37,009 | 20.9% |
[ 1.0% - 1.5% ] 1.20% | 9,327 | 20.3% |
[ 1.0% - 1.5% ] 1.25% | 18,058 | 22.1% |
[ 1.0% - 1.5% ] 1.31% | 8,519 | 15.5% |
[ 1.0% - 1.5% ] 1.38% | 4,428 | 19.6% |
[ 1.0% - 1.5% ] 1.42% | 3,863 | 22.1% |
[ 1.0% - 1.5% ] 1.44% | 12,132 | 23.7% |
[ 1.5% - 2.0% ] 1.51% | 21,586 | 13.8% |
[ 1.5% - 2.0% ] 1.57% | 25,089 | 12.1% |
[ 1.5% - 2.0% ] 1.61% | 12,553 | 16.6% |
[ 1.5% - 2.0% ] 1.71% | 24,800 | 13.5% |
[ 1.5% - 2.0% ] 1.77% | 9,115 | 24.0% |
[ 1.5% - 2.0% ] 1.82% | 10,525 | 11.7% |
[ 1.5% - 2.0% ] 1.85% | 4,046 | 19.9% |
[ 1.5% - 2.0% ] 1.93% | 2,119 | 13.4% |
[ 1.5% - 2.0% ] 1.96% | 3,766 | 17.0% |
[ 2.0% - 2.5% ] 2.02% | 7,741 | 9.6% |
[ 2.0% - 2.5% ] 2.10% | 5,964 | 19.5% |
[ 2.0% - 2.5% ] 2.18% | 12,524 | 13.0% |
[ 2.0% - 2.5% ] 2.22% | 856 | 21.7% |
[ 2.0% - 2.5% ] 2.28% | 1,054 | 12.7% |
[ 2.0% - 2.5% ] 2.34% | 128 | 31.2% |
[ 2.0% - 2.5% ] 2.41% | 16,879 | 16.3% |
[ 2.0% - 2.5% ] 2.44% | 4,597 | 29.4% |
[ 2.0% - 2.5% ] 2.47% | 364 | 8.0% |
[ 2.5% - 3.0% ] 2.54% | 5,560 | 18.4% |
[ 2.5% - 3.0% ] 2.57% | 2,486 | 21.7% |
[ 2.5% - 3.0% ] 2.62% | 3,854 | 9.4% |
[ 2.5% - 3.0% ] 2.69% | 781 | 15.2% |
[ 2.5% - 3.0% ] 2.82% | 71 | 5.6% |
[ 2.5% - 3.0% ] 2.86% | 5,279 | 18.1% |
[ 2.5% - 3.0% ] 2.91% | 3,122 | 13.6% |
[ 2.5% - 3.0% ] 2.95% | 1,220 | 20.6% |
[ 3.0% - 3.5% ] 3.00% | 1,700 | 11.2% |
[ 3.0% - 3.5% ] 3.04% | 988 | 26.6% |
[ 3.0% - 3.5% ] 3.16% | 729 | 34.5% |
[ 3.0% - 3.5% ] 3.27% | 1,468 | 16.2% |
[ 3.0% - 3.5% ] 3.29% | 2,702 | 25.1% |
[ 3.5% - 4.0% ] 3.60% | 2,863 | 13.8% |
[ 3.5% - 4.0% ] 3.85% | 52 | 3.8% |
[ 3.5% - 4.0% ] 3.88% | 103 | 14.6% |
[ 3.5% - 4.0% ] 3.97% | 604 | 22.0% |
[ 4.0% - 4.5% ] 4.01% | 424 | 18.4% |
[ 4.0% - 4.5% ] 4.18% | 1,077 | 19.9% |
[ 4.0% - 4.5% ] 4.22% | 2,298 | 14.1% |
[ 4.0% - 4.5% ] 4.35% | 138 | 10.9% |
[ 4.5% - 5.0% ] 4.60% | 7,087 | 14.7% |
[ 4.5% - 5.0% ] 4.82% | 1,059 | 11.9% |
[ 4.5% - 5.0% ] 4.87% | 1,457 | 8.0% |
[ 4.5% - 5.0% ] 4.94% | 81 | 12.3% |
[ 5.0% - 5.5% ] 5.08% | 118 | 30.5% |
[ 5.0% - 5.5% ] 5.26% | 38 | 13.2% |
[ 5.0% - 5.5% ] 5.37% | 428 | 23.6% |
[ 5.5% - 6.0% ] 5.57% | 3,179 | 18.1% |
[ 6.0% - 6.5% ] 6.46% | 681 | 16.6% |
[ 6.5% - 7.0% ] 6.74% | 89 | 13.5% |
[ 8.0% - 8.5% ] 8.14% | 2,679 | 19.1% |
[ 8.0% - 8.5% ] 8.17% | 1,396 | 23.8% |
[ 8.0% - 8.5% ] 8.44% | 308 | 16.6% |
[ 8.5% - 9.0% ] 8.81% | 295 | 17.3% |
[ 9.5% - 10.0% ] 9.52% | 21 | 19.0% |
[ 10.0% - 10.5% ] 10.26% | 234 | 29.1% |
[ 11.5% - 12.0% ] 11.58% | 95 | 10.5% |
[ 13.5% - 14.0% ] 13.55% | 251 | 15.9% |
[ 25.5% - 26.0% ] 25.56% | 583 | 7.7% |
[ 50.0% - 50.5% ] 50.00% | 4 | 50.0% |