Celtic Married-couple Households
COMPARE
Celtic
Select to Compare
Married-couple Households
Celtic Married-couple Households
47.3%
MARRIED-COUPLE HOUSEHOLDS
88.1/ 100
METRIC RATING
127th/ 347
METRIC RANK
Celtic Married-couple Households Correlation Chart
The statistical analysis conducted on geographies consisting of 168,846,519 people shows a moderate positive correlation between the proportion of Celtics and percentage of married-couple family households in the United States with a correlation coefficient (R) of 0.429 and weighted average of 47.3%. On average, for every 1% (one percent) increase in Celtics within a typical geography, there is an increase of 1.1% in percentage of married-couple family households.
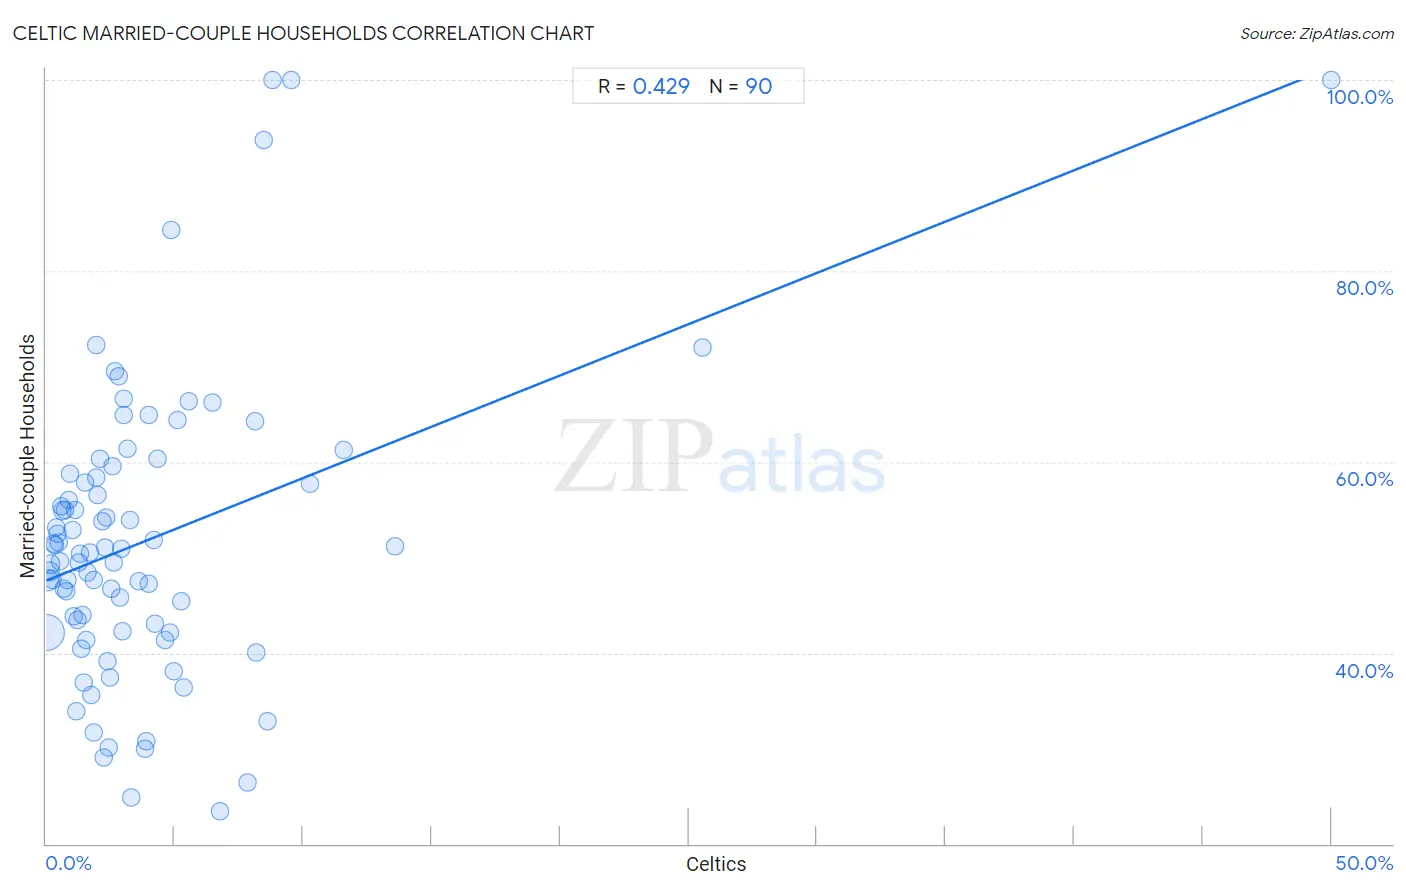
It is essential to understand that the correlation between the percentage of Celtics and percentage of married-couple family households does not imply a direct cause-and-effect relationship. It remains uncertain whether the presence of Celtics influences an upward or downward trend in the level of percentage of married-couple family households within an area, or if Celtics simply ended up residing in those areas with higher or lower levels of percentage of married-couple family households due to other factors.
Demographics Similar to Celtics by Married-couple Households
In terms of married-couple households, the demographic groups most similar to Celtics are Immigrants from Peru (47.3%, a difference of 0.020%), Immigrants from Iraq (47.3%, a difference of 0.030%), Immigrants from Hungary (47.3%, a difference of 0.030%), Pakistani (47.3%, a difference of 0.040%), and Immigrants from Denmark (47.3%, a difference of 0.050%).
| Demographics | Rating | Rank | Married-couple Households |
| Puget Sound Salish | 90.5 /100 | #120 | Exceptional 47.4% |
| Immigrants from Eastern Europe | 90.3 /100 | #121 | Exceptional 47.4% |
| Okinawans | 90.1 /100 | #122 | Exceptional 47.4% |
| Immigrants from Venezuela | 89.3 /100 | #123 | Excellent 47.4% |
| Zimbabweans | 89.2 /100 | #124 | Excellent 47.4% |
| Australians | 89.0 /100 | #125 | Excellent 47.4% |
| Pakistanis | 88.6 /100 | #126 | Excellent 47.3% |
| Celtics | 88.1 /100 | #127 | Excellent 47.3% |
| Immigrants from Peru | 87.9 /100 | #128 | Excellent 47.3% |
| Immigrants from Iraq | 87.8 /100 | #129 | Excellent 47.3% |
| Immigrants from Hungary | 87.8 /100 | #130 | Excellent 47.3% |
| Immigrants from Denmark | 87.5 /100 | #131 | Excellent 47.3% |
| Immigrants from Ukraine | 86.7 /100 | #132 | Excellent 47.3% |
| South Africans | 86.4 /100 | #133 | Excellent 47.3% |
| Immigrants from Greece | 86.0 /100 | #134 | Excellent 47.2% |
Celtic Married-couple Households Correlation Summary
| Measurement | Celtic Data | Married-couple Households Data |
| Minimum | 0.018% | 23.4% |
| Maximum | 50.0% | 100.0% |
| Range | 50.0% | 76.6% |
| Mean | 3.9% | 51.8% |
| Median | 2.4% | 50.4% |
| Interquartile 25% (IQ1) | 1.2% | 42.3% |
| Interquartile 75% (IQ3) | 4.3% | 58.3% |
| Interquartile Range (IQR) | 3.2% | 16.1% |
| Standard Deviation (Sample) | 6.1% | 15.3% |
| Standard Deviation (Population) | 6.1% | 15.3% |
Correlation Details
| Celtic Percentile | Sample Size | Married-couple Households |
[ 0.0% - 0.5% ] 0.018% | 128,358,982 | 42.2% |
[ 0.0% - 0.5% ] 0.071% | 22,462,117 | 47.6% |
[ 0.0% - 0.5% ] 0.12% | 8,185,215 | 48.5% |
[ 0.0% - 0.5% ] 0.18% | 3,387,918 | 49.3% |
[ 0.0% - 0.5% ] 0.23% | 2,187,799 | 47.7% |
[ 0.0% - 0.5% ] 0.28% | 1,329,627 | 51.4% |
[ 0.0% - 0.5% ] 0.33% | 584,043 | 51.4% |
[ 0.0% - 0.5% ] 0.39% | 409,327 | 53.1% |
[ 0.0% - 0.5% ] 0.44% | 182,804 | 52.5% |
[ 0.0% - 0.5% ] 0.49% | 260,088 | 51.6% |
[ 0.5% - 1.0% ] 0.54% | 206,059 | 49.6% |
[ 0.5% - 1.0% ] 0.59% | 129,384 | 55.3% |
[ 0.5% - 1.0% ] 0.65% | 223,409 | 54.9% |
[ 0.5% - 1.0% ] 0.70% | 98,770 | 46.8% |
[ 0.5% - 1.0% ] 0.73% | 116,482 | 54.9% |
[ 0.5% - 1.0% ] 0.79% | 203,109 | 46.4% |
[ 0.5% - 1.0% ] 0.85% | 41,516 | 47.6% |
[ 0.5% - 1.0% ] 0.89% | 23,937 | 56.0% |
[ 0.5% - 1.0% ] 0.94% | 71,295 | 58.7% |
[ 1.0% - 1.5% ] 1.01% | 25,649 | 52.9% |
[ 1.0% - 1.5% ] 1.06% | 11,331 | 43.9% |
[ 1.0% - 1.5% ] 1.11% | 32,648 | 55.0% |
[ 1.0% - 1.5% ] 1.15% | 37,009 | 33.9% |
[ 1.0% - 1.5% ] 1.20% | 9,327 | 43.5% |
[ 1.0% - 1.5% ] 1.25% | 18,058 | 49.5% |
[ 1.0% - 1.5% ] 1.31% | 8,519 | 50.4% |
[ 1.0% - 1.5% ] 1.38% | 4,428 | 40.5% |
[ 1.0% - 1.5% ] 1.42% | 3,863 | 43.9% |
[ 1.0% - 1.5% ] 1.44% | 12,132 | 36.9% |
[ 1.5% - 2.0% ] 1.51% | 21,586 | 57.8% |
[ 1.5% - 2.0% ] 1.57% | 25,089 | 41.3% |
[ 1.5% - 2.0% ] 1.61% | 12,553 | 48.4% |
[ 1.5% - 2.0% ] 1.71% | 24,800 | 50.5% |
[ 1.5% - 2.0% ] 1.77% | 9,115 | 35.6% |
[ 1.5% - 2.0% ] 1.82% | 10,525 | 47.6% |
[ 1.5% - 2.0% ] 1.85% | 4,046 | 31.6% |
[ 1.5% - 2.0% ] 1.93% | 2,119 | 72.2% |
[ 1.5% - 2.0% ] 1.96% | 3,766 | 58.3% |
[ 2.0% - 2.5% ] 2.02% | 7,741 | 56.5% |
[ 2.0% - 2.5% ] 2.10% | 5,964 | 60.3% |
[ 2.0% - 2.5% ] 2.18% | 12,524 | 53.8% |
[ 2.0% - 2.5% ] 2.22% | 856 | 29.1% |
[ 2.0% - 2.5% ] 2.28% | 1,054 | 51.0% |
[ 2.0% - 2.5% ] 2.34% | 128 | 54.2% |
[ 2.0% - 2.5% ] 2.41% | 16,879 | 39.1% |
[ 2.0% - 2.5% ] 2.44% | 4,597 | 30.1% |
[ 2.0% - 2.5% ] 2.47% | 364 | 37.4% |
[ 2.5% - 3.0% ] 2.54% | 5,560 | 46.7% |
[ 2.5% - 3.0% ] 2.57% | 2,486 | 59.6% |
[ 2.5% - 3.0% ] 2.62% | 3,854 | 49.5% |
[ 2.5% - 3.0% ] 2.69% | 781 | 69.5% |
[ 2.5% - 3.0% ] 2.82% | 71 | 69.0% |
[ 2.5% - 3.0% ] 2.86% | 5,279 | 45.8% |
[ 2.5% - 3.0% ] 2.91% | 3,122 | 50.9% |
[ 2.5% - 3.0% ] 2.95% | 1,220 | 42.3% |
[ 3.0% - 3.5% ] 3.00% | 1,700 | 66.6% |
[ 3.0% - 3.5% ] 3.04% | 988 | 64.9% |
[ 3.0% - 3.5% ] 3.16% | 729 | 61.4% |
[ 3.0% - 3.5% ] 3.27% | 1,468 | 53.9% |
[ 3.0% - 3.5% ] 3.29% | 2,702 | 24.8% |
[ 3.5% - 4.0% ] 3.60% | 2,863 | 47.5% |
[ 3.5% - 4.0% ] 3.85% | 52 | 30.0% |
[ 3.5% - 4.0% ] 3.88% | 103 | 30.8% |
[ 3.5% - 4.0% ] 3.97% | 604 | 65.0% |
[ 4.0% - 4.5% ] 4.01% | 424 | 47.3% |
[ 4.0% - 4.5% ] 4.18% | 1,077 | 51.8% |
[ 4.0% - 4.5% ] 4.22% | 2,298 | 43.1% |
[ 4.0% - 4.5% ] 4.35% | 138 | 60.3% |
[ 4.5% - 5.0% ] 4.60% | 7,087 | 41.3% |
[ 4.5% - 5.0% ] 4.82% | 1,059 | 42.1% |
[ 4.5% - 5.0% ] 4.87% | 1,457 | 84.3% |
[ 4.5% - 5.0% ] 4.94% | 81 | 38.1% |
[ 5.0% - 5.5% ] 5.08% | 118 | 64.4% |
[ 5.0% - 5.5% ] 5.26% | 38 | 45.5% |
[ 5.0% - 5.5% ] 5.37% | 428 | 36.4% |
[ 5.5% - 6.0% ] 5.57% | 3,179 | 66.4% |
[ 6.0% - 6.5% ] 6.46% | 681 | 66.3% |
[ 6.5% - 7.0% ] 6.74% | 89 | 23.4% |
[ 7.5% - 8.0% ] 7.81% | 192 | 26.4% |
[ 8.0% - 8.5% ] 8.14% | 2,679 | 64.2% |
[ 8.0% - 8.5% ] 8.17% | 1,396 | 40.1% |
[ 8.0% - 8.5% ] 8.44% | 308 | 93.7% |
[ 8.5% - 9.0% ] 8.62% | 174 | 32.9% |
[ 8.5% - 9.0% ] 8.81% | 295 | 100.0% |
[ 9.5% - 10.0% ] 9.52% | 21 | 100.0% |
[ 10.0% - 10.5% ] 10.26% | 234 | 57.7% |
[ 11.5% - 12.0% ] 11.58% | 95 | 61.2% |
[ 13.5% - 14.0% ] 13.55% | 251 | 51.2% |
[ 25.5% - 26.0% ] 25.56% | 583 | 72.0% |
[ 50.0% - 50.5% ] 50.00% | 4 | 100.0% |