Celtic Receiving Food Stamps
COMPARE
Celtic
Select to Compare
Receiving Food Stamps
Celtic Receiving Food Stamps
10.9%
PUBLIC INCOME | FOOD STAMPS
87.8/ 100
METRIC RATING
140th/ 347
METRIC RANK
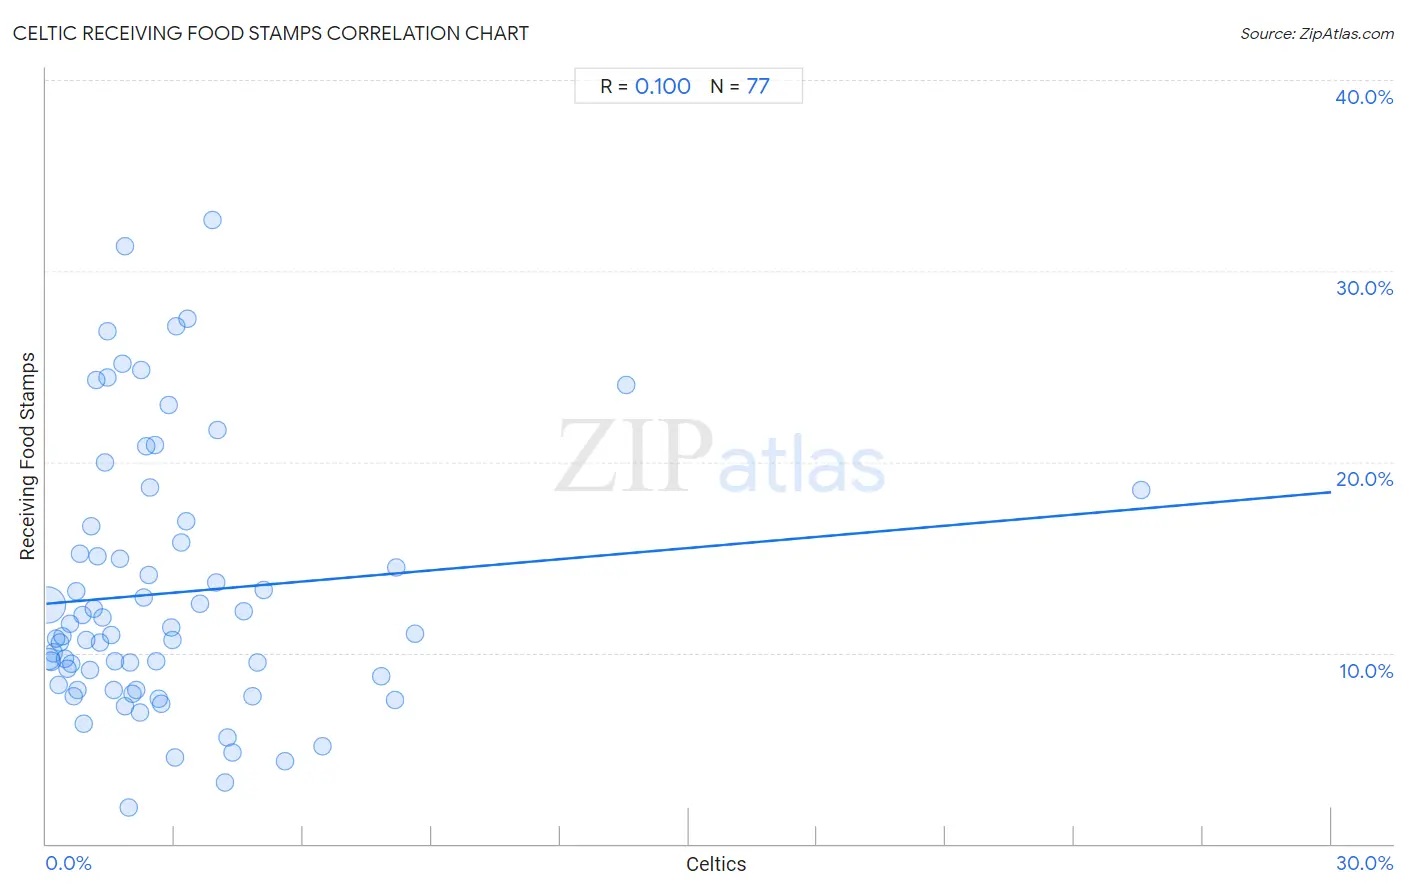
Celtic Receiving Food Stamps Correlation Chart
The statistical analysis conducted on geographies consisting of 168,687,125 people shows a slight positive correlation between the proportion of Celtics and percentage of population receiving government assistance and/or food stamps in the United States with a correlation coefficient (R) of 0.100 and weighted average of 10.9%. On average, for every 1% (one percent) increase in Celtics within a typical geography, there is an increase of 0.19% in percentage of population receiving government assistance and/or food stamps.
It is essential to understand that the correlation between the percentage of Celtics and percentage of population receiving government assistance and/or food stamps does not imply a direct cause-and-effect relationship. It remains uncertain whether the presence of Celtics influences an upward or downward trend in the level of percentage of population receiving government assistance and/or food stamps within an area, or if Celtics simply ended up residing in those areas with higher or lower levels of percentage of population receiving government assistance and/or food stamps due to other factors.
Demographics Similar to Celtics by Receiving Food Stamps
In terms of receiving food stamps, the demographic groups most similar to Celtics are Hmong (10.9%, a difference of 0.20%), Immigrants from Moldova (10.9%, a difference of 0.24%), Immigrants from Vietnam (11.0%, a difference of 0.36%), Chilean (11.0%, a difference of 0.53%), and Immigrants from Northern Africa (11.0%, a difference of 0.61%).
| Demographics | Rating | Rank | Receiving Food Stamps |
| Immigrants from Russia | 90.9 /100 | #133 | Exceptional 10.8% |
| Immigrants from Brazil | 90.3 /100 | #134 | Exceptional 10.8% |
| Argentineans | 90.2 /100 | #135 | Exceptional 10.8% |
| Slovaks | 89.8 /100 | #136 | Excellent 10.8% |
| Immigrants from Eastern Europe | 89.8 /100 | #137 | Excellent 10.8% |
| Immigrants from Moldova | 88.5 /100 | #138 | Excellent 10.9% |
| Hmong | 88.4 /100 | #139 | Excellent 10.9% |
| Celtics | 87.8 /100 | #140 | Excellent 10.9% |
| Immigrants from Vietnam | 86.7 /100 | #141 | Excellent 11.0% |
| Chileans | 86.2 /100 | #142 | Excellent 11.0% |
| Immigrants from Northern Africa | 86.0 /100 | #143 | Excellent 11.0% |
| Syrians | 85.5 /100 | #144 | Excellent 11.0% |
| Hungarians | 85.1 /100 | #145 | Excellent 11.0% |
| Taiwanese | 84.2 /100 | #146 | Excellent 11.0% |
| Whites/Caucasians | 83.9 /100 | #147 | Excellent 11.1% |
Celtic Receiving Food Stamps Correlation Summary
| Measurement | Celtic Data | Receiving Food Stamps Data |
| Minimum | 0.018% | 1.9% |
| Maximum | 25.6% | 32.7% |
| Range | 25.5% | 30.8% |
| Mean | 2.9% | 13.1% |
| Median | 2.0% | 11.0% |
| Interquartile 25% (IQ1) | 0.98% | 8.2% |
| Interquartile 75% (IQ3) | 3.4% | 16.2% |
| Interquartile Range (IQR) | 2.5% | 8.0% |
| Standard Deviation (Sample) | 3.5% | 6.9% |
| Standard Deviation (Population) | 3.5% | 6.8% |
Correlation Details
| Celtic Percentile | Sample Size | Receiving Food Stamps |
[ 0.0% - 0.5% ] 0.018% | 128,364,253 | 12.5% |
[ 0.0% - 0.5% ] 0.071% | 22,449,701 | 9.7% |
[ 0.0% - 0.5% ] 0.12% | 8,146,030 | 9.6% |
[ 0.0% - 0.5% ] 0.18% | 3,360,475 | 10.0% |
[ 0.0% - 0.5% ] 0.23% | 2,168,234 | 10.7% |
[ 0.0% - 0.5% ] 0.28% | 1,324,863 | 8.3% |
[ 0.0% - 0.5% ] 0.33% | 582,150 | 10.5% |
[ 0.0% - 0.5% ] 0.39% | 404,096 | 10.8% |
[ 0.0% - 0.5% ] 0.44% | 171,206 | 9.7% |
[ 0.0% - 0.5% ] 0.49% | 253,117 | 9.2% |
[ 0.5% - 1.0% ] 0.54% | 203,789 | 11.5% |
[ 0.5% - 1.0% ] 0.59% | 129,384 | 9.4% |
[ 0.5% - 1.0% ] 0.65% | 223,409 | 7.7% |
[ 0.5% - 1.0% ] 0.70% | 96,310 | 13.2% |
[ 0.5% - 1.0% ] 0.73% | 116,207 | 8.1% |
[ 0.5% - 1.0% ] 0.79% | 201,164 | 15.2% |
[ 0.5% - 1.0% ] 0.85% | 41,050 | 12.0% |
[ 0.5% - 1.0% ] 0.89% | 23,937 | 6.3% |
[ 0.5% - 1.0% ] 0.94% | 64,729 | 10.7% |
[ 1.0% - 1.5% ] 1.01% | 25,649 | 9.1% |
[ 1.0% - 1.5% ] 1.06% | 10,472 | 16.6% |
[ 1.0% - 1.5% ] 1.11% | 32,648 | 12.3% |
[ 1.0% - 1.5% ] 1.15% | 35,625 | 24.3% |
[ 1.0% - 1.5% ] 1.20% | 9,162 | 15.1% |
[ 1.0% - 1.5% ] 1.25% | 17,823 | 10.5% |
[ 1.0% - 1.5% ] 1.31% | 6,772 | 11.9% |
[ 1.0% - 1.5% ] 1.38% | 3,689 | 20.0% |
[ 1.0% - 1.5% ] 1.42% | 3,720 | 24.4% |
[ 1.0% - 1.5% ] 1.44% | 12,132 | 26.8% |
[ 1.5% - 2.0% ] 1.51% | 16,736 | 11.0% |
[ 1.5% - 2.0% ] 1.57% | 24,834 | 8.0% |
[ 1.5% - 2.0% ] 1.61% | 12,553 | 9.5% |
[ 1.5% - 2.0% ] 1.71% | 20,481 | 15.0% |
[ 1.5% - 2.0% ] 1.77% | 9,115 | 25.1% |
[ 1.5% - 2.0% ] 1.82% | 10,525 | 7.2% |
[ 1.5% - 2.0% ] 1.85% | 3,084 | 31.3% |
[ 1.5% - 2.0% ] 1.93% | 2,119 | 1.9% |
[ 1.5% - 2.0% ] 1.96% | 3,766 | 9.5% |
[ 2.0% - 2.5% ] 2.01% | 5,767 | 7.9% |
[ 2.0% - 2.5% ] 2.10% | 5,964 | 8.0% |
[ 2.0% - 2.5% ] 2.18% | 12,524 | 6.9% |
[ 2.0% - 2.5% ] 2.22% | 856 | 24.8% |
[ 2.0% - 2.5% ] 2.28% | 1,054 | 12.9% |
[ 2.0% - 2.5% ] 2.34% | 128 | 20.8% |
[ 2.0% - 2.5% ] 2.41% | 16,879 | 14.1% |
[ 2.0% - 2.5% ] 2.44% | 4,597 | 18.6% |
[ 2.5% - 3.0% ] 2.54% | 5,560 | 20.9% |
[ 2.5% - 3.0% ] 2.57% | 2,486 | 9.5% |
[ 2.5% - 3.0% ] 2.62% | 3,778 | 7.6% |
[ 2.5% - 3.0% ] 2.69% | 781 | 7.3% |
[ 2.5% - 3.0% ] 2.86% | 4,930 | 23.0% |
[ 2.5% - 3.0% ] 2.92% | 3,018 | 11.3% |
[ 2.5% - 3.0% ] 2.95% | 1,220 | 10.7% |
[ 3.0% - 3.5% ] 3.00% | 1,700 | 4.5% |
[ 3.0% - 3.5% ] 3.04% | 988 | 27.1% |
[ 3.0% - 3.5% ] 3.16% | 729 | 15.8% |
[ 3.0% - 3.5% ] 3.27% | 1,468 | 16.9% |
[ 3.0% - 3.5% ] 3.29% | 2,702 | 27.5% |
[ 3.5% - 4.0% ] 3.60% | 2,863 | 12.6% |
[ 3.5% - 4.0% ] 3.88% | 103 | 32.7% |
[ 3.5% - 4.0% ] 3.97% | 604 | 13.7% |
[ 4.0% - 4.5% ] 4.01% | 424 | 21.7% |
[ 4.0% - 4.5% ] 4.18% | 1,077 | 3.2% |
[ 4.0% - 4.5% ] 4.22% | 2,298 | 5.6% |
[ 4.0% - 4.5% ] 4.35% | 138 | 4.8% |
[ 4.5% - 5.0% ] 4.60% | 7,087 | 12.2% |
[ 4.5% - 5.0% ] 4.82% | 1,059 | 7.7% |
[ 4.5% - 5.0% ] 4.94% | 81 | 9.5% |
[ 5.0% - 5.5% ] 5.08% | 118 | 13.3% |
[ 5.5% - 6.0% ] 5.57% | 3,179 | 4.3% |
[ 6.0% - 6.5% ] 6.46% | 681 | 5.1% |
[ 7.5% - 8.0% ] 7.81% | 192 | 8.8% |
[ 8.0% - 8.5% ] 8.14% | 2,679 | 7.5% |
[ 8.0% - 8.5% ] 8.17% | 1,396 | 14.5% |
[ 8.5% - 9.0% ] 8.62% | 174 | 11.0% |
[ 13.5% - 14.0% ] 13.55% | 251 | 24.0% |
[ 25.5% - 26.0% ] 25.56% | 583 | 18.5% |