Celtic Married-Couple Family Poverty
COMPARE
Celtic
Select to Compare
Married-Couple Family Poverty
Celtic Married-Couple Family Poverty
4.8%
POVERTY | MARRIED-COUPLE FAMILIES
94.8/ 100
METRIC RATING
116th/ 347
METRIC RANK
Celtic Married-Couple Family Poverty Correlation Chart
The statistical analysis conducted on geographies consisting of 167,973,280 people shows a near-perfect positive correlation between the proportion of Celtics and poverty level among married-couple families in the United States with a correlation coefficient (R) of 0.945 and weighted average of 4.8%. On average, for every 1% (one percent) increase in Celtics within a typical geography, there is an increase of 1.9% in poverty level among married-couple families.
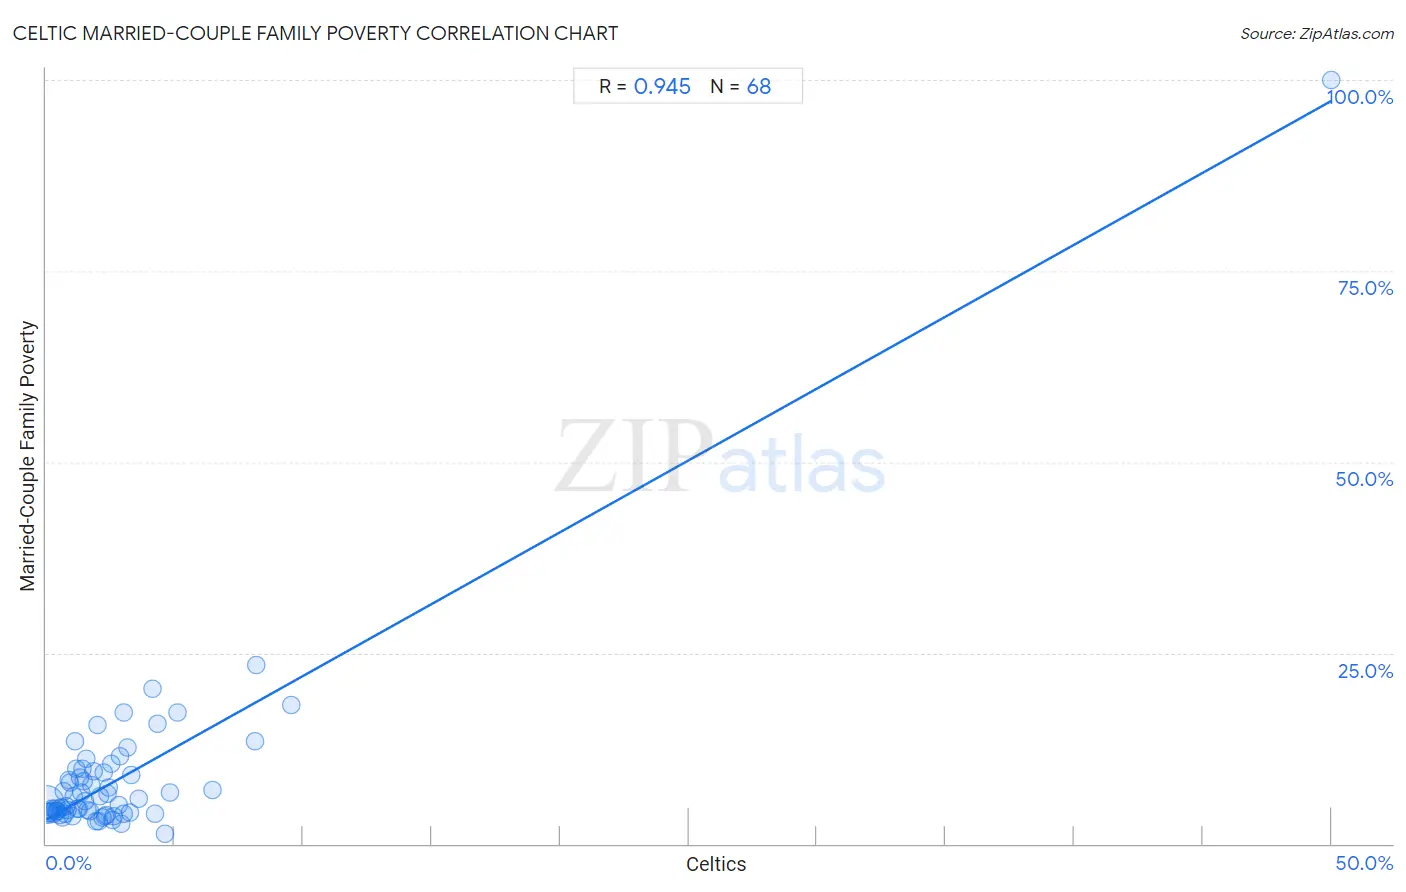
It is essential to understand that the correlation between the percentage of Celtics and poverty level among married-couple families does not imply a direct cause-and-effect relationship. It remains uncertain whether the presence of Celtics influences an upward or downward trend in the level of poverty level among married-couple families within an area, or if Celtics simply ended up residing in those areas with higher or lower levels of poverty level among married-couple families due to other factors.
Demographics Similar to Celtics by Married-Couple Family Poverty
In terms of married-couple family poverty, the demographic groups most similar to Celtics are Taiwanese (4.8%, a difference of 0.010%), Kenyan (4.8%, a difference of 0.10%), Immigrants from Philippines (4.8%, a difference of 0.12%), Immigrants from Indonesia (4.8%, a difference of 0.16%), and Immigrants from Eastern Asia (4.8%, a difference of 0.48%).
| Demographics | Rating | Rank | Married-Couple Family Poverty |
| Immigrants from Hong Kong | 96.4 /100 | #109 | Exceptional 4.7% |
| Immigrants from Bolivia | 96.2 /100 | #110 | Exceptional 4.7% |
| Pakistanis | 96.2 /100 | #111 | Exceptional 4.7% |
| Tongans | 95.9 /100 | #112 | Exceptional 4.7% |
| Immigrants from Nepal | 95.9 /100 | #113 | Exceptional 4.7% |
| Immigrants from Indonesia | 95.1 /100 | #114 | Exceptional 4.8% |
| Taiwanese | 94.8 /100 | #115 | Exceptional 4.8% |
| Celtics | 94.8 /100 | #116 | Exceptional 4.8% |
| Kenyans | 94.7 /100 | #117 | Exceptional 4.8% |
| Immigrants from Philippines | 94.6 /100 | #118 | Exceptional 4.8% |
| Immigrants from Eastern Asia | 94.0 /100 | #119 | Exceptional 4.8% |
| Immigrants from Southern Europe | 93.4 /100 | #120 | Exceptional 4.8% |
| Indians (Asian) | 93.2 /100 | #121 | Exceptional 4.8% |
| Whites/Caucasians | 93.1 /100 | #122 | Exceptional 4.8% |
| Jordanians | 93.1 /100 | #123 | Exceptional 4.8% |
Celtic Married-Couple Family Poverty Correlation Summary
| Measurement | Celtic Data | Married-Couple Family Poverty Data |
| Minimum | 0.018% | 1.3% |
| Maximum | 50.0% | 100.0% |
| Range | 50.0% | 98.7% |
| Mean | 2.9% | 8.7% |
| Median | 1.8% | 5.4% |
| Interquartile 25% (IQ1) | 0.87% | 4.1% |
| Interquartile 75% (IQ3) | 3.0% | 9.4% |
| Interquartile Range (IQR) | 2.1% | 5.4% |
| Standard Deviation (Sample) | 6.1% | 12.2% |
| Standard Deviation (Population) | 6.1% | 12.1% |
Correlation Details
| Celtic Percentile | Sample Size | Married-Couple Family Poverty |
[ 0.0% - 0.5% ] 0.018% | 128,282,331 | 5.3% |
[ 0.0% - 0.5% ] 0.071% | 22,326,526 | 4.0% |
[ 0.0% - 0.5% ] 0.12% | 8,038,184 | 4.2% |
[ 0.0% - 0.5% ] 0.18% | 3,316,627 | 4.3% |
[ 0.0% - 0.5% ] 0.23% | 2,136,412 | 4.6% |
[ 0.0% - 0.5% ] 0.28% | 1,279,790 | 4.0% |
[ 0.0% - 0.5% ] 0.33% | 547,793 | 4.5% |
[ 0.0% - 0.5% ] 0.39% | 374,071 | 4.3% |
[ 0.0% - 0.5% ] 0.44% | 135,693 | 4.2% |
[ 0.0% - 0.5% ] 0.49% | 233,651 | 4.6% |
[ 0.5% - 1.0% ] 0.54% | 186,518 | 3.7% |
[ 0.5% - 1.0% ] 0.59% | 111,335 | 4.7% |
[ 0.5% - 1.0% ] 0.65% | 218,179 | 3.4% |
[ 0.5% - 1.0% ] 0.70% | 70,544 | 6.8% |
[ 0.5% - 1.0% ] 0.73% | 95,382 | 4.0% |
[ 0.5% - 1.0% ] 0.79% | 194,813 | 5.0% |
[ 0.5% - 1.0% ] 0.85% | 35,253 | 4.5% |
[ 0.5% - 1.0% ] 0.89% | 18,546 | 8.4% |
[ 0.5% - 1.0% ] 0.94% | 65,294 | 8.0% |
[ 1.0% - 1.5% ] 1.01% | 25,454 | 3.6% |
[ 1.0% - 1.5% ] 1.06% | 9,374 | 6.3% |
[ 1.0% - 1.5% ] 1.11% | 22,677 | 13.5% |
[ 1.0% - 1.5% ] 1.15% | 36,660 | 9.8% |
[ 1.0% - 1.5% ] 1.20% | 9,327 | 4.6% |
[ 1.0% - 1.5% ] 1.25% | 17,196 | 4.7% |
[ 1.0% - 1.5% ] 1.32% | 6,001 | 8.8% |
[ 1.0% - 1.5% ] 1.36% | 1,173 | 6.7% |
[ 1.0% - 1.5% ] 1.42% | 2,395 | 9.9% |
[ 1.0% - 1.5% ] 1.44% | 12,132 | 8.2% |
[ 1.5% - 2.0% ] 1.51% | 16,736 | 5.6% |
[ 1.5% - 2.0% ] 1.58% | 20,633 | 11.1% |
[ 1.5% - 2.0% ] 1.61% | 7,992 | 4.4% |
[ 1.5% - 2.0% ] 1.71% | 21,887 | 4.3% |
[ 1.5% - 2.0% ] 1.77% | 9,115 | 7.8% |
[ 1.5% - 2.0% ] 1.85% | 3,084 | 9.5% |
[ 1.5% - 2.0% ] 1.94% | 2,015 | 3.0% |
[ 1.5% - 2.0% ] 1.98% | 1,159 | 15.6% |
[ 2.0% - 2.5% ] 2.02% | 1,186 | 2.9% |
[ 2.0% - 2.5% ] 2.10% | 5,964 | 6.2% |
[ 2.0% - 2.5% ] 2.17% | 7,556 | 3.5% |
[ 2.0% - 2.5% ] 2.22% | 856 | 9.4% |
[ 2.0% - 2.5% ] 2.27% | 484 | 3.5% |
[ 2.0% - 2.5% ] 2.34% | 128 | 3.8% |
[ 2.0% - 2.5% ] 2.41% | 16,376 | 6.6% |
[ 2.0% - 2.5% ] 2.44% | 4,597 | 7.4% |
[ 2.5% - 3.0% ] 2.54% | 5,560 | 10.4% |
[ 2.5% - 3.0% ] 2.57% | 817 | 3.2% |
[ 2.5% - 3.0% ] 2.62% | 3,778 | 3.6% |
[ 2.5% - 3.0% ] 2.82% | 71 | 5.0% |
[ 2.5% - 3.0% ] 2.86% | 4,930 | 11.5% |
[ 2.5% - 3.0% ] 2.92% | 3,018 | 2.6% |
[ 3.0% - 3.5% ] 3.00% | 1,700 | 4.0% |
[ 3.0% - 3.5% ] 3.03% | 726 | 17.1% |
[ 3.0% - 3.5% ] 3.16% | 729 | 12.6% |
[ 3.0% - 3.5% ] 3.27% | 1,468 | 4.1% |
[ 3.0% - 3.5% ] 3.29% | 2,702 | 9.1% |
[ 3.5% - 4.0% ] 3.60% | 2,863 | 5.9% |
[ 4.0% - 4.5% ] 4.16% | 385 | 20.3% |
[ 4.0% - 4.5% ] 4.22% | 2,251 | 4.0% |
[ 4.0% - 4.5% ] 4.35% | 138 | 15.8% |
[ 4.5% - 5.0% ] 4.60% | 7,087 | 1.3% |
[ 4.5% - 5.0% ] 4.82% | 1,059 | 6.7% |
[ 5.0% - 5.5% ] 5.08% | 118 | 17.2% |
[ 6.0% - 6.5% ] 6.46% | 681 | 7.1% |
[ 8.0% - 8.5% ] 8.14% | 2,679 | 13.5% |
[ 8.0% - 8.5% ] 8.17% | 1,396 | 23.5% |
[ 9.5% - 10.0% ] 9.52% | 21 | 18.2% |
[ 50.0% - 50.5% ] 50.00% | 4 | 100.0% |