Asian Married-Couple Family Poverty
COMPARE
Asian
Select to Compare
Married-Couple Family Poverty
Asian Married-Couple Family Poverty
4.7%
POVERTY | MARRIED-COUPLE FAMILIES
97.6/ 100
METRIC RATING
102nd/ 347
METRIC RANK
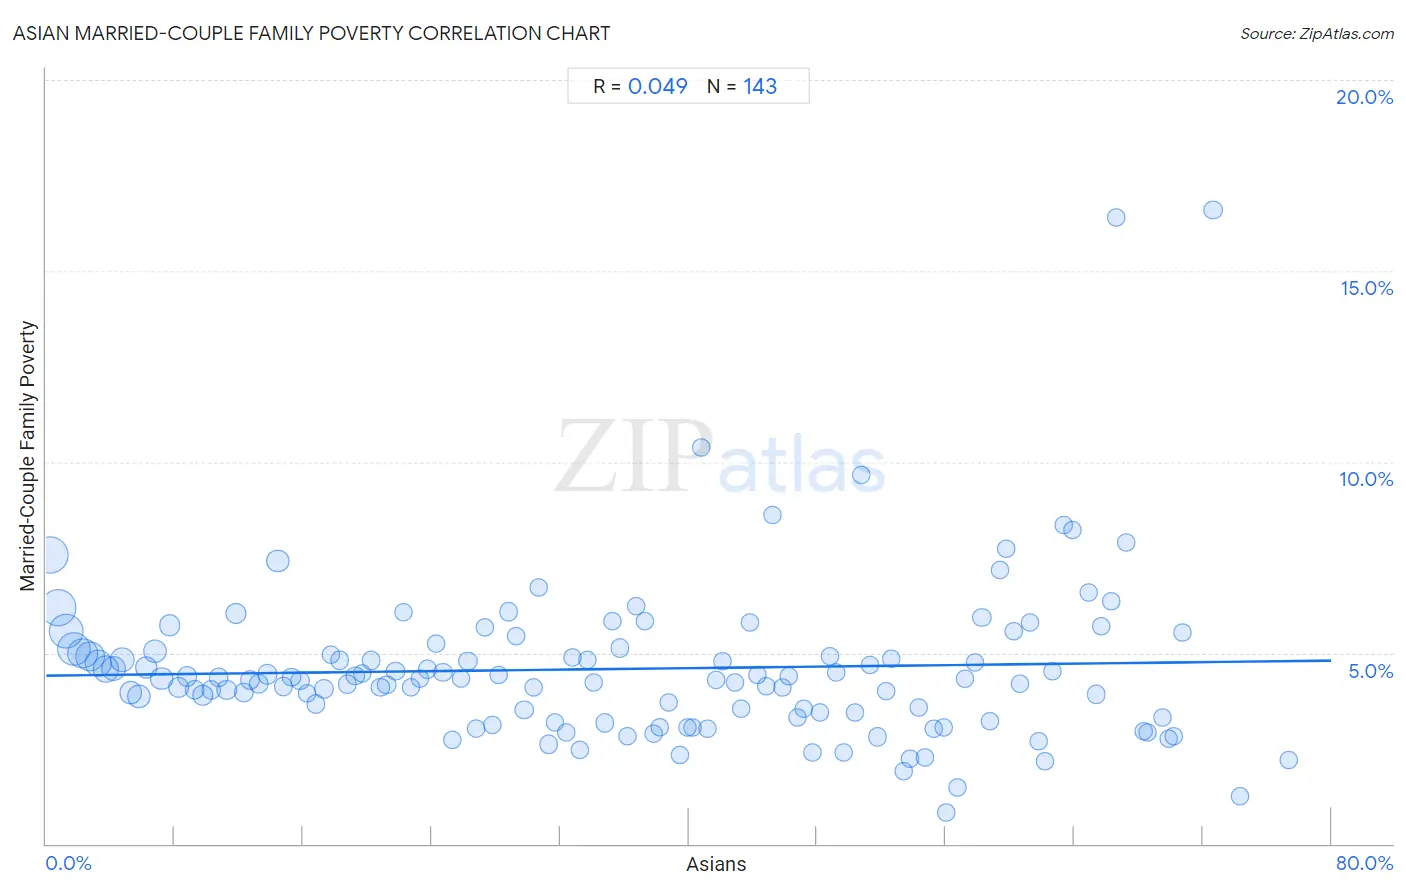
Asian Married-Couple Family Poverty Correlation Chart
The statistical analysis conducted on geographies consisting of 539,455,145 people shows no correlation between the proportion of Asians and poverty level among married-couple families in the United States with a correlation coefficient (R) of 0.049 and weighted average of 4.7%. On average, for every 1% (one percent) increase in Asians within a typical geography, there is an increase of 0.0049% in poverty level among married-couple families.
It is essential to understand that the correlation between the percentage of Asians and poverty level among married-couple families does not imply a direct cause-and-effect relationship. It remains uncertain whether the presence of Asians influences an upward or downward trend in the level of poverty level among married-couple families within an area, or if Asians simply ended up residing in those areas with higher or lower levels of poverty level among married-couple families due to other factors.
Demographics Similar to Asians by Married-Couple Family Poverty
In terms of married-couple family poverty, the demographic groups most similar to Asians are Immigrants from Romania (4.7%, a difference of 0.29%), Yugoslavian (4.6%, a difference of 0.40%), Immigrants from Western Europe (4.6%, a difference of 0.42%), Immigrants from Europe (4.6%, a difference of 0.53%), and Immigrants from Moldova (4.7%, a difference of 0.63%).
| Demographics | Rating | Rank | Married-Couple Family Poverty |
| Portuguese | 98.3 /100 | #95 | Exceptional 4.6% |
| Immigrants from Poland | 98.3 /100 | #96 | Exceptional 4.6% |
| Immigrants from Belgium | 98.2 /100 | #97 | Exceptional 4.6% |
| Native Hawaiians | 98.0 /100 | #98 | Exceptional 4.6% |
| Immigrants from Europe | 97.9 /100 | #99 | Exceptional 4.6% |
| Immigrants from Western Europe | 97.9 /100 | #100 | Exceptional 4.6% |
| Yugoslavians | 97.8 /100 | #101 | Exceptional 4.6% |
| Asians | 97.6 /100 | #102 | Exceptional 4.7% |
| Immigrants from Romania | 97.3 /100 | #103 | Exceptional 4.7% |
| Immigrants from Moldova | 97.1 /100 | #104 | Exceptional 4.7% |
| Aleuts | 97.0 /100 | #105 | Exceptional 4.7% |
| Immigrants from France | 96.9 /100 | #106 | Exceptional 4.7% |
| Immigrants from Germany | 96.8 /100 | #107 | Exceptional 4.7% |
| Laotians | 96.6 /100 | #108 | Exceptional 4.7% |
| Immigrants from Hong Kong | 96.4 /100 | #109 | Exceptional 4.7% |
Asian Married-Couple Family Poverty Correlation Summary
| Measurement | Asian Data | Married-Couple Family Poverty Data |
| Minimum | 0.26% | 0.82% |
| Maximum | 77.3% | 16.6% |
| Range | 77.1% | 15.8% |
| Mean | 35.9% | 4.6% |
| Median | 35.7% | 4.3% |
| Interquartile 25% (IQ1) | 17.7% | 3.3% |
| Interquartile 75% (IQ3) | 53.8% | 5.1% |
| Interquartile Range (IQR) | 36.0% | 1.7% |
| Standard Deviation (Sample) | 21.0% | 2.1% |
| Standard Deviation (Population) | 20.9% | 2.1% |
Correlation Details
| Asian Percentile | Sample Size | Married-Couple Family Poverty |
[ 0.0% - 0.5% ] 0.26% | 51,934,574 | 7.6% |
[ 0.5% - 1.0% ] 0.74% | 51,006,298 | 6.2% |
[ 1.0% - 1.5% ] 1.25% | 45,476,718 | 5.6% |
[ 1.5% - 2.0% ] 1.74% | 40,599,467 | 5.1% |
[ 2.0% - 2.5% ] 2.25% | 33,581,596 | 5.0% |
[ 2.5% - 3.0% ] 2.73% | 30,535,662 | 4.9% |
[ 3.0% - 3.5% ] 3.24% | 27,119,859 | 4.7% |
[ 3.5% - 4.0% ] 3.73% | 22,663,873 | 4.6% |
[ 4.0% - 4.5% ] 4.21% | 18,432,060 | 4.6% |
[ 4.5% - 5.0% ] 4.73% | 18,660,634 | 4.8% |
[ 5.0% - 5.5% ] 5.26% | 13,282,833 | 4.0% |
[ 5.5% - 6.0% ] 5.75% | 13,069,452 | 3.9% |
[ 6.0% - 6.5% ] 6.24% | 10,283,959 | 4.6% |
[ 6.5% - 7.0% ] 6.76% | 13,980,615 | 5.1% |
[ 7.0% - 7.5% ] 7.18% | 11,519,942 | 4.3% |
[ 7.5% - 8.0% ] 7.71% | 8,458,848 | 5.7% |
[ 8.0% - 8.5% ] 8.27% | 7,473,827 | 4.1% |
[ 8.5% - 9.0% ] 8.76% | 5,554,902 | 4.4% |
[ 9.0% - 9.5% ] 9.25% | 5,143,037 | 4.0% |
[ 9.5% - 10.0% ] 9.75% | 5,568,116 | 3.9% |
[ 10.0% - 10.5% ] 10.25% | 3,869,962 | 4.0% |
[ 10.5% - 11.0% ] 10.77% | 3,890,917 | 4.3% |
[ 11.0% - 11.5% ] 11.23% | 4,133,603 | 4.0% |
[ 11.5% - 12.0% ] 11.79% | 8,608,157 | 6.0% |
[ 12.0% - 12.5% ] 12.27% | 3,050,478 | 3.9% |
[ 12.5% - 13.0% ] 12.72% | 3,359,043 | 4.3% |
[ 13.0% - 13.5% ] 13.26% | 3,544,818 | 4.2% |
[ 13.5% - 14.0% ] 13.74% | 3,953,230 | 4.4% |
[ 14.0% - 14.5% ] 14.40% | 12,002,275 | 7.4% |
[ 14.5% - 15.0% ] 14.77% | 2,083,442 | 4.1% |
[ 15.0% - 15.5% ] 15.27% | 1,958,394 | 4.4% |
[ 15.5% - 16.0% ] 15.78% | 3,016,060 | 4.3% |
[ 16.0% - 16.5% ] 16.24% | 2,338,273 | 3.9% |
[ 16.5% - 17.0% ] 16.79% | 2,236,355 | 3.7% |
[ 17.0% - 17.5% ] 17.31% | 2,586,176 | 4.1% |
[ 17.5% - 18.0% ] 17.71% | 1,962,562 | 5.0% |
[ 18.0% - 18.5% ] 18.28% | 2,017,601 | 4.8% |
[ 18.5% - 19.0% ] 18.74% | 1,234,928 | 4.2% |
[ 19.0% - 19.5% ] 19.25% | 2,057,256 | 4.4% |
[ 19.5% - 20.0% ] 19.68% | 1,839,162 | 4.5% |
[ 20.0% - 20.5% ] 20.25% | 878,371 | 4.8% |
[ 20.5% - 21.0% ] 20.80% | 1,152,677 | 4.1% |
[ 21.0% - 21.5% ] 21.20% | 983,049 | 4.2% |
[ 21.5% - 22.0% ] 21.75% | 484,300 | 4.5% |
[ 22.0% - 22.5% ] 22.26% | 1,489,368 | 6.1% |
[ 22.5% - 23.0% ] 22.73% | 1,206,412 | 4.1% |
[ 23.0% - 23.5% ] 23.26% | 779,767 | 4.3% |
[ 23.5% - 24.0% ] 23.75% | 715,506 | 4.6% |
[ 24.0% - 24.5% ] 24.24% | 757,699 | 5.3% |
[ 24.5% - 25.0% ] 24.70% | 679,385 | 4.5% |
[ 25.0% - 25.5% ] 25.28% | 952,742 | 2.7% |
[ 25.5% - 26.0% ] 25.80% | 1,130,186 | 4.3% |
[ 26.0% - 26.5% ] 26.26% | 1,013,079 | 4.8% |
[ 26.5% - 27.0% ] 26.78% | 868,044 | 3.0% |
[ 27.0% - 27.5% ] 27.30% | 799,652 | 5.7% |
[ 27.5% - 28.0% ] 27.76% | 456,679 | 3.1% |
[ 28.0% - 28.5% ] 28.15% | 395,643 | 4.4% |
[ 28.5% - 29.0% ] 28.77% | 844,648 | 6.1% |
[ 29.0% - 29.5% ] 29.25% | 628,250 | 5.4% |
[ 29.5% - 30.0% ] 29.75% | 849,902 | 3.5% |
[ 30.0% - 30.5% ] 30.33% | 680,658 | 4.1% |
[ 30.5% - 31.0% ] 30.69% | 309,455 | 6.7% |
[ 31.0% - 31.5% ] 31.25% | 435,356 | 2.6% |
[ 31.5% - 32.0% ] 31.70% | 353,816 | 3.2% |
[ 32.0% - 32.5% ] 32.36% | 283,079 | 2.9% |
[ 32.5% - 33.0% ] 32.74% | 370,096 | 4.9% |
[ 33.0% - 33.5% ] 33.24% | 510,629 | 2.5% |
[ 33.5% - 34.0% ] 33.68% | 512,415 | 4.8% |
[ 34.0% - 34.5% ] 34.06% | 100,564 | 4.2% |
[ 34.5% - 35.0% ] 34.79% | 1,313,739 | 3.2% |
[ 35.0% - 35.5% ] 35.24% | 333,222 | 5.8% |
[ 35.5% - 36.0% ] 35.71% | 533,981 | 5.1% |
[ 36.0% - 36.5% ] 36.18% | 134,264 | 2.8% |
[ 36.5% - 37.0% ] 36.72% | 477,098 | 6.2% |
[ 37.0% - 37.5% ] 37.30% | 562,602 | 5.8% |
[ 37.5% - 38.0% ] 37.79% | 443,736 | 2.9% |
[ 38.0% - 38.5% ] 38.17% | 1,330,444 | 3.0% |
[ 38.5% - 39.0% ] 38.79% | 211,394 | 3.7% |
[ 39.0% - 39.5% ] 39.47% | 244,170 | 2.3% |
[ 39.5% - 40.0% ] 39.89% | 297,845 | 3.0% |
[ 40.0% - 40.5% ] 40.27% | 148,867 | 3.0% |
[ 40.5% - 41.0% ] 40.75% | 143,246 | 10.4% |
[ 41.0% - 41.5% ] 41.20% | 214,066 | 3.0% |
[ 41.5% - 42.0% ] 41.68% | 558,500 | 4.3% |
[ 42.0% - 42.5% ] 42.12% | 120,670 | 4.8% |
[ 42.5% - 43.0% ] 42.85% | 178,995 | 4.2% |
[ 43.0% - 43.5% ] 43.29% | 286,848 | 3.5% |
[ 43.5% - 44.0% ] 43.84% | 213,582 | 5.8% |
[ 44.0% - 44.5% ] 44.29% | 406,566 | 4.4% |
[ 44.5% - 45.0% ] 44.80% | 142,721 | 4.1% |
[ 45.0% - 45.5% ] 45.22% | 61,578 | 8.6% |
[ 45.5% - 46.0% ] 45.82% | 31,342 | 4.1% |
[ 46.0% - 46.5% ] 46.25% | 59,951 | 4.4% |
[ 46.5% - 47.0% ] 46.76% | 184,785 | 3.3% |
[ 47.0% - 47.5% ] 47.19% | 195,881 | 3.5% |
[ 47.5% - 48.0% ] 47.74% | 128,808 | 2.4% |
[ 48.0% - 48.5% ] 48.13% | 228,738 | 3.4% |
[ 48.5% - 49.0% ] 48.80% | 147,248 | 4.9% |
[ 49.0% - 49.5% ] 49.17% | 268,981 | 4.5% |
[ 49.5% - 50.0% ] 49.63% | 208,332 | 2.4% |
[ 50.0% - 50.5% ] 50.33% | 156,308 | 3.4% |
[ 50.5% - 51.0% ] 50.75% | 219,428 | 9.7% |
[ 51.0% - 51.5% ] 51.31% | 193,613 | 4.7% |
[ 51.5% - 52.0% ] 51.77% | 120,112 | 2.8% |
[ 52.0% - 52.5% ] 52.26% | 536,099 | 4.0% |
[ 52.5% - 53.0% ] 52.61% | 81,639 | 4.8% |
[ 53.0% - 53.5% ] 53.39% | 179,255 | 1.9% |
[ 53.5% - 54.0% ] 53.75% | 154,771 | 2.2% |
[ 54.0% - 54.5% ] 54.31% | 152,214 | 3.6% |
[ 54.5% - 55.0% ] 54.69% | 164,139 | 2.3% |
[ 55.0% - 55.5% ] 55.23% | 68,047 | 3.0% |
[ 55.5% - 56.0% ] 55.87% | 195,849 | 3.0% |
[ 56.0% - 56.5% ] 56.01% | 16,722 | 0.82% |
[ 56.5% - 57.0% ] 56.73% | 21,402 | 1.5% |
[ 57.0% - 57.5% ] 57.17% | 94,153 | 4.3% |
[ 57.5% - 58.0% ] 57.83% | 66,247 | 4.7% |
[ 58.0% - 58.5% ] 58.25% | 132,282 | 5.9% |
[ 58.5% - 59.0% ] 58.79% | 229,316 | 3.2% |
[ 59.0% - 59.5% ] 59.41% | 93,745 | 7.2% |
[ 59.5% - 60.0% ] 59.77% | 43,851 | 7.7% |
[ 60.0% - 60.5% ] 60.23% | 187,009 | 5.6% |
[ 60.5% - 61.0% ] 60.60% | 153,666 | 4.2% |
[ 61.0% - 61.5% ] 61.27% | 132,470 | 5.8% |
[ 61.5% - 62.0% ] 61.81% | 265,452 | 2.7% |
[ 62.0% - 62.5% ] 62.16% | 21,823 | 2.2% |
[ 62.5% - 63.0% ] 62.67% | 166,706 | 4.5% |
[ 63.0% - 63.5% ] 63.33% | 56,910 | 8.3% |
[ 63.5% - 64.0% ] 63.93% | 59,410 | 8.2% |
[ 64.5% - 65.0% ] 64.88% | 101,367 | 6.6% |
[ 65.0% - 65.5% ] 65.39% | 116,730 | 3.9% |
[ 65.5% - 66.0% ] 65.67% | 64,377 | 5.7% |
[ 66.0% - 66.5% ] 66.31% | 4,185 | 6.4% |
[ 66.5% - 67.0% ] 66.58% | 54,137 | 16.4% |
[ 67.0% - 67.5% ] 67.23% | 39,873 | 7.9% |
[ 68.0% - 68.5% ] 68.31% | 25,001 | 2.9% |
[ 68.5% - 69.0% ] 68.56% | 39,565 | 2.9% |
[ 69.0% - 69.5% ] 69.46% | 7,786 | 3.3% |
[ 69.5% - 70.0% ] 69.85% | 219,899 | 2.7% |
[ 70.0% - 70.5% ] 70.18% | 68,613 | 2.8% |
[ 70.5% - 71.0% ] 70.74% | 57,753 | 5.5% |
[ 72.5% - 73.0% ] 72.64% | 79,495 | 16.6% |
[ 74.0% - 74.5% ] 74.33% | 37,671 | 1.3% |
[ 77.0% - 77.5% ] 77.32% | 53,464 | 2.2% |