Asian Householder Income Under 25 years
COMPARE
Asian
Select to Compare
Householder Income Under 25 years
Asian Householder Income Under 25 years
$57,003
HOUSEHOLD INCOME | AGE < 25
100.0/ 100
METRIC RATING
22nd/ 347
METRIC RANK
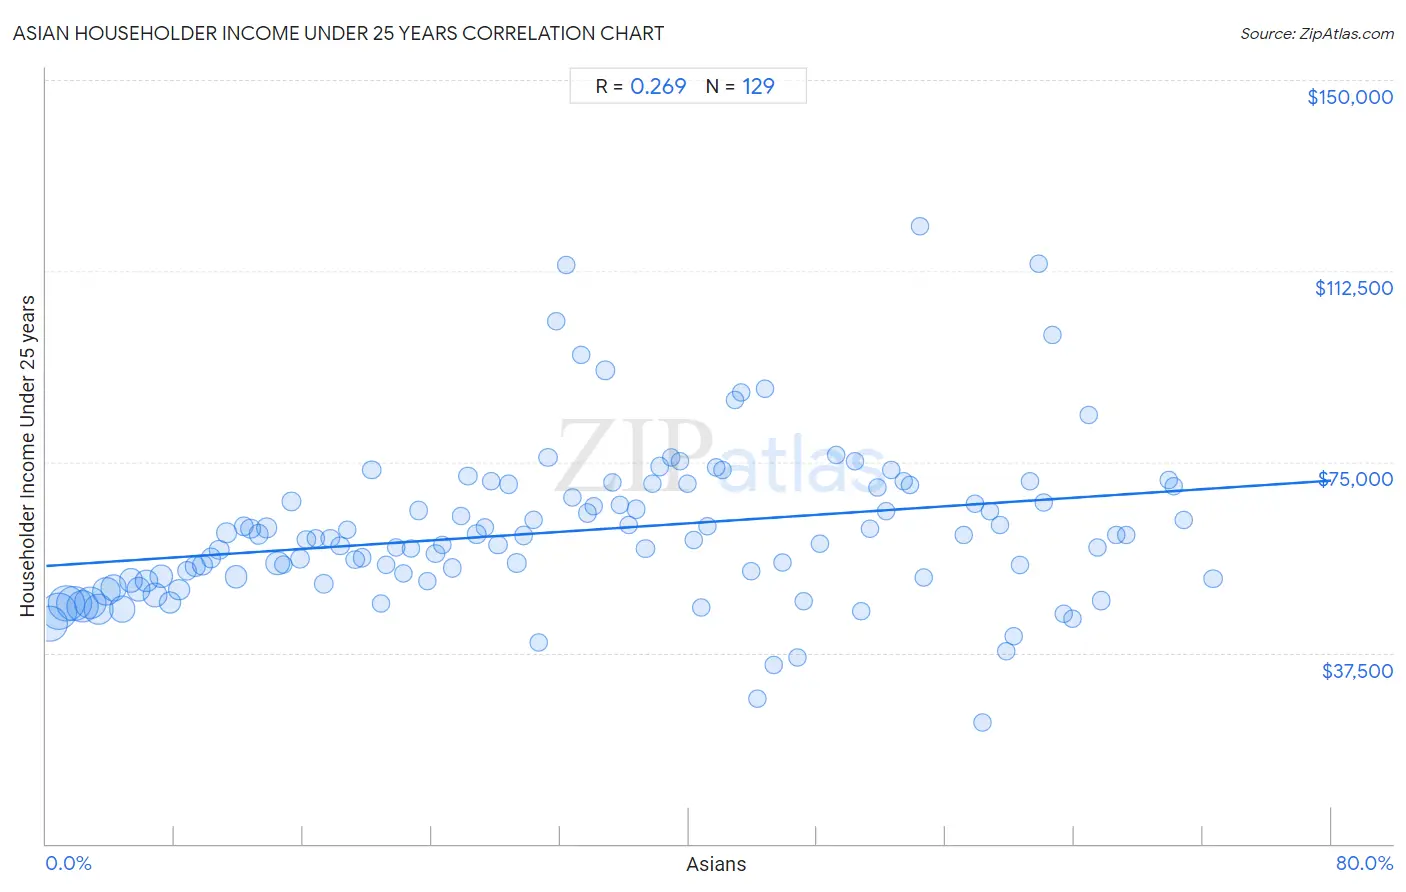
Asian Householder Income Under 25 years Correlation Chart
The statistical analysis conducted on geographies consisting of 432,159,205 people shows a weak positive correlation between the proportion of Asians and household income with householder under the age of 25 in the United States with a correlation coefficient (R) of 0.269 and weighted average of $57,003. On average, for every 1% (one percent) increase in Asians within a typical geography, there is an increase of $209 in household income with householder under the age of 25.
It is essential to understand that the correlation between the percentage of Asians and household income with householder under the age of 25 does not imply a direct cause-and-effect relationship. It remains uncertain whether the presence of Asians influences an upward or downward trend in the level of household income with householder under the age of 25 within an area, or if Asians simply ended up residing in those areas with higher or lower levels of household income with householder under the age of 25 due to other factors.
Demographics Similar to Asians by Householder Income Under 25 years
In terms of householder income under 25 years, the demographic groups most similar to Asians are Tongan ($56,972, a difference of 0.050%), Immigrants from Fiji ($57,074, a difference of 0.12%), Bhutanese ($57,078, a difference of 0.13%), Immigrants from Ireland ($57,075, a difference of 0.13%), and Immigrants from Eastern Asia ($57,123, a difference of 0.21%).
| Demographics | Rating | Rank | Householder Income Under 25 years |
| Koreans | 100.0 /100 | #15 | Exceptional $57,730 |
| Immigrants from Afghanistan | 100.0 /100 | #16 | Exceptional $57,478 |
| Sierra Leoneans | 100.0 /100 | #17 | Exceptional $57,272 |
| Immigrants from Eastern Asia | 100.0 /100 | #18 | Exceptional $57,123 |
| Bhutanese | 100.0 /100 | #19 | Exceptional $57,078 |
| Immigrants from Ireland | 100.0 /100 | #20 | Exceptional $57,075 |
| Immigrants from Fiji | 100.0 /100 | #21 | Exceptional $57,074 |
| Asians | 100.0 /100 | #22 | Exceptional $57,003 |
| Tongans | 100.0 /100 | #23 | Exceptional $56,972 |
| Immigrants from Singapore | 100.0 /100 | #24 | Exceptional $56,835 |
| Immigrants from Pakistan | 100.0 /100 | #25 | Exceptional $56,789 |
| Immigrants from Australia | 100.0 /100 | #26 | Exceptional $56,660 |
| Immigrants from North Macedonia | 100.0 /100 | #27 | Exceptional $56,503 |
| Immigrants from Peru | 100.0 /100 | #28 | Exceptional $56,384 |
| Immigrants from Asia | 100.0 /100 | #29 | Exceptional $56,379 |
Asian Householder Income Under 25 years Correlation Summary
| Measurement | Asian Data | Householder Income Under 25 years Data |
| Minimum | 0.26% | $23,919 |
| Maximum | 72.6% | $121,254 |
| Range | 72.4% | $97,335 |
| Mean | 33.3% | $61,525 |
| Median | 32.4% | $59,979 |
| Interquartile 25% (IQ1) | 16.0% | $51,878 |
| Interquartile 75% (IQ3) | 50.5% | $70,096 |
| Interquartile Range (IQR) | 34.5% | $18,219 |
| Standard Deviation (Sample) | 20.1% | $15,684 |
| Standard Deviation (Population) | 20.1% | $15,623 |
Correlation Details
| Asian Percentile | Sample Size | Householder Income Under 25 years |
[ 0.0% - 0.5% ] 0.26% | 34,908,052 | $43,178 |
[ 0.5% - 1.0% ] 0.74% | 37,010,604 | $45,592 |
[ 1.0% - 1.5% ] 1.26% | 36,038,657 | $47,178 |
[ 1.5% - 2.0% ] 1.74% | 33,197,686 | $47,250 |
[ 2.0% - 2.5% ] 2.25% | 26,822,317 | $46,547 |
[ 2.5% - 3.0% ] 2.73% | 26,139,216 | $47,388 |
[ 3.0% - 3.5% ] 3.24% | 22,690,011 | $46,046 |
[ 3.5% - 4.0% ] 3.73% | 19,188,157 | $49,568 |
[ 4.0% - 4.5% ] 4.21% | 15,591,363 | $50,224 |
[ 4.5% - 5.0% ] 4.73% | 15,815,043 | $46,033 |
[ 5.0% - 5.5% ] 5.26% | 11,010,204 | $51,692 |
[ 5.5% - 6.0% ] 5.75% | 10,461,203 | $49,974 |
[ 6.0% - 6.5% ] 6.23% | 8,936,589 | $51,598 |
[ 6.5% - 7.0% ] 6.77% | 12,172,544 | $48,880 |
[ 7.0% - 7.5% ] 7.16% | 9,759,815 | $52,457 |
[ 7.5% - 8.0% ] 7.69% | 7,371,106 | $47,413 |
[ 8.0% - 8.5% ] 8.28% | 6,071,586 | $49,876 |
[ 8.5% - 9.0% ] 8.77% | 4,347,672 | $53,597 |
[ 9.0% - 9.5% ] 9.26% | 3,974,599 | $54,447 |
[ 9.5% - 10.0% ] 9.75% | 4,759,027 | $54,726 |
[ 10.0% - 10.5% ] 10.25% | 3,302,567 | $56,105 |
[ 10.5% - 11.0% ] 10.76% | 3,178,551 | $57,741 |
[ 11.0% - 11.5% ] 11.23% | 3,527,834 | $61,039 |
[ 11.5% - 12.0% ] 11.80% | 7,933,973 | $52,416 |
[ 12.0% - 12.5% ] 12.28% | 2,158,103 | $62,357 |
[ 12.5% - 13.0% ] 12.72% | 2,671,989 | $61,954 |
[ 13.0% - 13.5% ] 13.25% | 2,723,570 | $60,766 |
[ 13.5% - 14.0% ] 13.73% | 3,363,786 | $61,991 |
[ 14.0% - 14.5% ] 14.41% | 11,567,024 | $55,061 |
[ 14.5% - 15.0% ] 14.75% | 1,682,658 | $54,809 |
[ 15.0% - 15.5% ] 15.27% | 1,636,153 | $67,192 |
[ 15.5% - 16.0% ] 15.78% | 2,405,452 | $55,922 |
[ 16.0% - 16.5% ] 16.22% | 1,826,369 | $59,767 |
[ 16.5% - 17.0% ] 16.80% | 1,665,788 | $59,979 |
[ 17.0% - 17.5% ] 17.31% | 2,326,720 | $51,149 |
[ 17.5% - 18.0% ] 17.69% | 1,481,167 | $60,011 |
[ 18.0% - 18.5% ] 18.30% | 1,711,455 | $58,520 |
[ 18.5% - 19.0% ] 18.76% | 916,193 | $61,704 |
[ 19.0% - 19.5% ] 19.25% | 1,684,765 | $55,779 |
[ 19.5% - 20.0% ] 19.67% | 1,608,026 | $56,107 |
[ 20.0% - 20.5% ] 20.27% | 612,137 | $73,381 |
[ 20.5% - 21.0% ] 20.82% | 996,454 | $47,246 |
[ 21.0% - 21.5% ] 21.15% | 632,121 | $54,708 |
[ 21.5% - 22.0% ] 21.77% | 338,694 | $58,197 |
[ 22.0% - 22.5% ] 22.25% | 1,368,154 | $53,145 |
[ 22.5% - 23.0% ] 22.73% | 1,006,811 | $57,994 |
[ 23.0% - 23.5% ] 23.19% | 542,170 | $65,465 |
[ 23.5% - 24.0% ] 23.74% | 481,828 | $51,575 |
[ 24.0% - 24.5% ] 24.23% | 582,858 | $56,927 |
[ 24.5% - 25.0% ] 24.65% | 452,279 | $58,665 |
[ 25.0% - 25.5% ] 25.27% | 705,327 | $54,141 |
[ 25.5% - 26.0% ] 25.82% | 986,580 | $64,392 |
[ 26.0% - 26.5% ] 26.26% | 752,445 | $72,183 |
[ 26.5% - 27.0% ] 26.79% | 810,588 | $60,793 |
[ 27.0% - 27.5% ] 27.30% | 633,245 | $62,070 |
[ 27.5% - 28.0% ] 27.70% | 304,160 | $71,262 |
[ 28.0% - 28.5% ] 28.13% | 350,074 | $58,707 |
[ 28.5% - 29.0% ] 28.81% | 529,366 | $70,586 |
[ 29.0% - 29.5% ] 29.30% | 373,464 | $55,147 |
[ 29.5% - 30.0% ] 29.70% | 594,779 | $60,517 |
[ 30.0% - 30.5% ] 30.33% | 567,192 | $63,542 |
[ 30.5% - 31.0% ] 30.64% | 140,005 | $39,483 |
[ 31.0% - 31.5% ] 31.24% | 291,863 | $75,826 |
[ 31.5% - 32.0% ] 31.72% | 78,913 | $102,611 |
[ 32.0% - 32.5% ] 32.37% | 76,654 | $113,742 |
[ 32.5% - 33.0% ] 32.74% | 279,864 | $68,073 |
[ 33.0% - 33.5% ] 33.27% | 406,113 | $96,038 |
[ 33.5% - 34.0% ] 33.67% | 281,922 | $64,955 |
[ 34.0% - 34.5% ] 34.05% | 95,390 | $66,191 |
[ 34.5% - 35.0% ] 34.80% | 1,210,262 | $92,991 |
[ 35.0% - 35.5% ] 35.22% | 284,568 | $70,960 |
[ 35.5% - 36.0% ] 35.72% | 382,188 | $66,586 |
[ 36.0% - 36.5% ] 36.27% | 75,909 | $62,712 |
[ 36.5% - 37.0% ] 36.71% | 464,167 | $65,713 |
[ 37.0% - 37.5% ] 37.31% | 531,105 | $57,887 |
[ 37.5% - 38.0% ] 37.77% | 291,177 | $70,680 |
[ 38.0% - 38.5% ] 38.17% | 1,260,563 | $74,032 |
[ 38.5% - 39.0% ] 38.88% | 110,290 | $75,808 |
[ 39.0% - 39.5% ] 39.48% | 189,173 | $75,166 |
[ 39.5% - 40.0% ] 39.94% | 245,955 | $70,748 |
[ 40.0% - 40.5% ] 40.35% | 74,947 | $59,642 |
[ 40.5% - 41.0% ] 40.74% | 117,700 | $46,410 |
[ 41.0% - 41.5% ] 41.16% | 182,946 | $62,321 |
[ 41.5% - 42.0% ] 41.68% | 499,754 | $73,944 |
[ 42.0% - 42.5% ] 42.10% | 64,908 | $73,441 |
[ 42.5% - 43.0% ] 42.84% | 112,158 | $87,260 |
[ 43.0% - 43.5% ] 43.30% | 254,550 | $88,695 |
[ 43.5% - 44.0% ] 43.86% | 197,769 | $53,507 |
[ 44.0% - 44.5% ] 44.30% | 358,518 | $28,533 |
[ 44.5% - 45.0% ] 44.77% | 107,002 | $89,366 |
[ 45.0% - 45.5% ] 45.32% | 38,400 | $35,075 |
[ 45.5% - 46.0% ] 45.82% | 22,030 | $55,170 |
[ 46.5% - 47.0% ] 46.81% | 53,727 | $36,525 |
[ 47.0% - 47.5% ] 47.19% | 191,539 | $47,696 |
[ 48.0% - 48.5% ] 48.15% | 142,619 | $58,917 |
[ 49.0% - 49.5% ] 49.16% | 244,081 | $76,421 |
[ 50.0% - 50.5% ] 50.33% | 149,556 | $75,116 |
[ 50.5% - 51.0% ] 50.74% | 181,268 | $45,724 |
[ 51.0% - 51.5% ] 51.30% | 118,692 | $61,783 |
[ 51.5% - 52.0% ] 51.73% | 67,388 | $69,990 |
[ 52.0% - 52.5% ] 52.26% | 502,272 | $65,378 |
[ 52.5% - 53.0% ] 52.58% | 74,866 | $73,332 |
[ 53.0% - 53.5% ] 53.40% | 175,351 | $71,088 |
[ 53.5% - 54.0% ] 53.74% | 165,668 | $70,395 |
[ 54.0% - 54.5% ] 54.42% | 88,177 | $121,254 |
[ 54.5% - 55.0% ] 54.62% | 46,812 | $52,208 |
[ 57.0% - 57.5% ] 57.10% | 12,070 | $60,625 |
[ 57.5% - 58.0% ] 57.83% | 66,247 | $66,724 |
[ 58.0% - 58.5% ] 58.25% | 106,413 | $23,919 |
[ 58.5% - 59.0% ] 58.77% | 159,356 | $65,246 |
[ 59.0% - 59.5% ] 59.41% | 93,745 | $62,493 |
[ 59.5% - 60.0% ] 59.77% | 43,851 | $37,763 |
[ 60.0% - 60.5% ] 60.24% | 153,072 | $40,797 |
[ 60.5% - 61.0% ] 60.60% | 153,666 | $54,795 |
[ 61.0% - 61.5% ] 61.23% | 86,782 | $71,156 |
[ 61.5% - 62.0% ] 61.81% | 265,452 | $113,939 |
[ 62.0% - 62.5% ] 62.09% | 15,585 | $67,105 |
[ 62.5% - 63.0% ] 62.63% | 143,983 | $99,981 |
[ 63.0% - 63.5% ] 63.36% | 51,043 | $45,263 |
[ 63.5% - 64.0% ] 63.93% | 59,410 | $44,181 |
[ 64.5% - 65.0% ] 64.88% | 101,367 | $84,116 |
[ 65.0% - 65.5% ] 65.45% | 75,353 | $58,153 |
[ 65.5% - 66.0% ] 65.67% | 64,377 | $47,753 |
[ 66.5% - 67.0% ] 66.58% | 53,371 | $60,709 |
[ 67.0% - 67.5% ] 67.23% | 39,873 | $60,556 |
[ 69.5% - 70.0% ] 69.88% | 61,414 | $71,452 |
[ 70.0% - 70.5% ] 70.17% | 59,763 | $70,202 |
[ 70.5% - 71.0% ] 70.84% | 26,418 | $63,611 |
[ 72.5% - 73.0% ] 72.64% | 79,495 | $52,063 |