Asian Unemployment Among Women with Children Ages 6 to 17 years
COMPARE
Asian
Select to Compare
Unemployment Among Women with Children Ages 6 to 17 years
Asian Unemployment Among Women with Children Ages 6 to 17 years
8.0%
UNEMPLOYMENT | WOMEN W/ CHILDREN 6 TO 17
100.0/ 100
METRIC RATING
37th/ 347
METRIC RANK
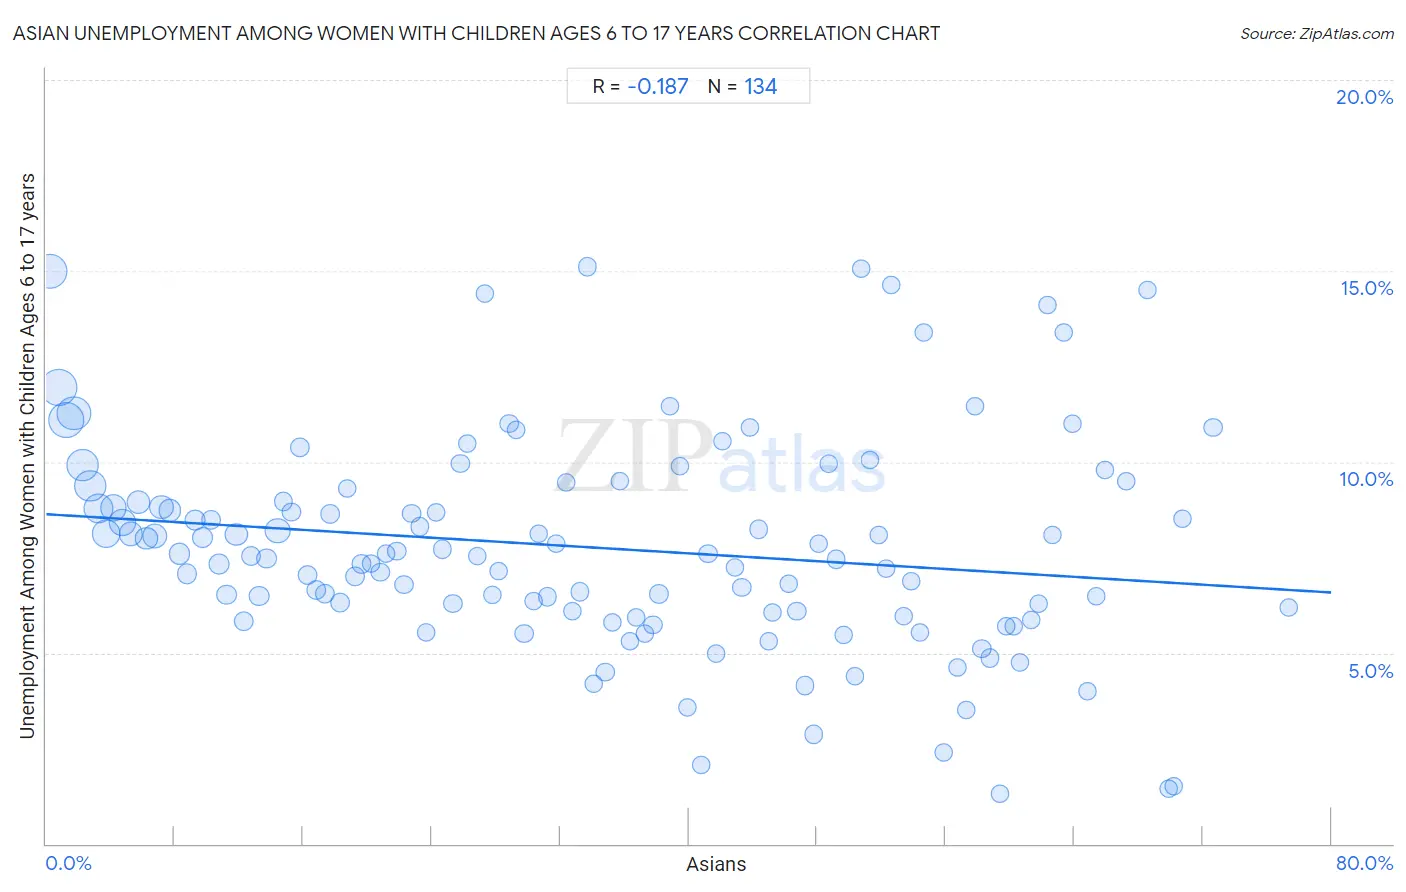
Asian Unemployment Among Women with Children Ages 6 to 17 years Correlation Chart
The statistical analysis conducted on geographies consisting of 355,293,130 people shows a poor negative correlation between the proportion of Asians and unemployment rate among women with children between the ages 6 and 17 in the United States with a correlation coefficient (R) of -0.187 and weighted average of 8.0%. On average, for every 1% (one percent) increase in Asians within a typical geography, there is a decrease of 0.026% in unemployment rate among women with children between the ages 6 and 17.
It is essential to understand that the correlation between the percentage of Asians and unemployment rate among women with children between the ages 6 and 17 does not imply a direct cause-and-effect relationship. It remains uncertain whether the presence of Asians influences an upward or downward trend in the level of unemployment rate among women with children between the ages 6 and 17 within an area, or if Asians simply ended up residing in those areas with higher or lower levels of unemployment rate among women with children between the ages 6 and 17 due to other factors.
Demographics Similar to Asians by Unemployment Among Women with Children Ages 6 to 17 years
In terms of unemployment among women with children ages 6 to 17 years, the demographic groups most similar to Asians are Burmese (8.0%, a difference of 0.030%), Immigrants from South Central Asia (7.9%, a difference of 0.11%), Native Hawaiian (7.9%, a difference of 0.22%), Alsatian (8.0%, a difference of 0.33%), and Somali (8.0%, a difference of 0.47%).
| Demographics | Rating | Rank | Unemployment Among Women with Children Ages 6 to 17 years |
| Immigrants from Iran | 100.0 /100 | #30 | Exceptional 7.9% |
| Laotians | 100.0 /100 | #31 | Exceptional 7.9% |
| Immigrants from Cambodia | 100.0 /100 | #32 | Exceptional 7.9% |
| Immigrants from Korea | 100.0 /100 | #33 | Exceptional 7.9% |
| Native Hawaiians | 100.0 /100 | #34 | Exceptional 7.9% |
| Immigrants from South Central Asia | 100.0 /100 | #35 | Exceptional 7.9% |
| Burmese | 100.0 /100 | #36 | Exceptional 8.0% |
| Asians | 100.0 /100 | #37 | Exceptional 8.0% |
| Alsatians | 100.0 /100 | #38 | Exceptional 8.0% |
| Somalis | 100.0 /100 | #39 | Exceptional 8.0% |
| Immigrants from Zimbabwe | 100.0 /100 | #40 | Exceptional 8.0% |
| Iranians | 100.0 /100 | #41 | Exceptional 8.0% |
| Immigrants from Somalia | 100.0 /100 | #42 | Exceptional 8.0% |
| Bhutanese | 100.0 /100 | #43 | Exceptional 8.1% |
| Immigrants from Sweden | 100.0 /100 | #44 | Exceptional 8.1% |
Asian Unemployment Among Women with Children Ages 6 to 17 years Correlation Summary
| Measurement | Asian Data | Unemployment Among Women with Children Ages 6 to 17 years Data |
| Minimum | 0.26% | 1.3% |
| Maximum | 77.3% | 15.1% |
| Range | 77.1% | 13.8% |
| Mean | 34.3% | 7.8% |
| Median | 33.5% | 7.5% |
| Interquartile 25% (IQ1) | 16.8% | 6.0% |
| Interquartile 75% (IQ3) | 51.3% | 9.0% |
| Interquartile Range (IQR) | 34.5% | 2.9% |
| Standard Deviation (Sample) | 20.5% | 2.8% |
| Standard Deviation (Population) | 20.4% | 2.8% |
Correlation Details
| Asian Percentile | Sample Size | Unemployment Among Women with Children Ages 6 to 17 years |
[ 0.0% - 0.5% ] 0.26% | 25,019,563 | 15.0% |
[ 0.5% - 1.0% ] 0.75% | 28,992,767 | 11.9% |
[ 1.0% - 1.5% ] 1.26% | 27,021,514 | 11.1% |
[ 1.5% - 2.0% ] 1.74% | 24,673,508 | 11.3% |
[ 2.0% - 2.5% ] 2.25% | 20,940,037 | 9.9% |
[ 2.5% - 3.0% ] 2.73% | 20,468,599 | 9.4% |
[ 3.0% - 3.5% ] 3.24% | 18,315,268 | 8.8% |
[ 3.5% - 4.0% ] 3.72% | 15,733,651 | 8.1% |
[ 4.0% - 4.5% ] 4.20% | 12,592,231 | 8.8% |
[ 4.5% - 5.0% ] 4.74% | 13,594,257 | 8.4% |
[ 5.0% - 5.5% ] 5.26% | 9,181,676 | 8.1% |
[ 5.5% - 6.0% ] 5.75% | 8,812,179 | 8.9% |
[ 6.0% - 6.5% ] 6.23% | 7,017,548 | 8.0% |
[ 6.5% - 7.0% ] 6.77% | 10,499,754 | 8.1% |
[ 7.0% - 7.5% ] 7.16% | 8,882,100 | 8.8% |
[ 7.5% - 8.0% ] 7.69% | 6,319,731 | 8.7% |
[ 8.0% - 8.5% ] 8.29% | 5,603,155 | 7.6% |
[ 8.5% - 9.0% ] 8.76% | 3,602,832 | 7.1% |
[ 9.0% - 9.5% ] 9.26% | 3,522,725 | 8.5% |
[ 9.5% - 10.0% ] 9.76% | 3,713,385 | 8.0% |
[ 10.0% - 10.5% ] 10.25% | 2,467,658 | 8.5% |
[ 10.5% - 11.0% ] 10.77% | 3,020,804 | 7.3% |
[ 11.0% - 11.5% ] 11.22% | 2,786,342 | 6.5% |
[ 11.5% - 12.0% ] 11.80% | 7,424,196 | 8.1% |
[ 12.0% - 12.5% ] 12.28% | 1,968,031 | 5.8% |
[ 12.5% - 13.0% ] 12.73% | 2,638,278 | 7.5% |
[ 13.0% - 13.5% ] 13.25% | 2,714,177 | 6.5% |
[ 13.5% - 14.0% ] 13.73% | 2,789,553 | 7.5% |
[ 14.0% - 14.5% ] 14.42% | 11,093,576 | 8.2% |
[ 14.5% - 15.0% ] 14.75% | 1,238,589 | 9.0% |
[ 15.0% - 15.5% ] 15.29% | 1,353,026 | 8.7% |
[ 15.5% - 16.0% ] 15.79% | 2,333,402 | 10.4% |
[ 16.0% - 16.5% ] 16.25% | 1,767,882 | 7.0% |
[ 16.5% - 17.0% ] 16.79% | 1,892,161 | 6.7% |
[ 17.0% - 17.5% ] 17.32% | 2,207,872 | 6.6% |
[ 17.5% - 18.0% ] 17.69% | 1,498,349 | 8.6% |
[ 18.0% - 18.5% ] 18.30% | 1,654,041 | 6.3% |
[ 18.5% - 19.0% ] 18.74% | 837,950 | 9.3% |
[ 19.0% - 19.5% ] 19.26% | 1,661,199 | 7.0% |
[ 19.5% - 20.0% ] 19.65% | 1,322,013 | 7.3% |
[ 20.0% - 20.5% ] 20.24% | 611,925 | 7.3% |
[ 20.5% - 21.0% ] 20.80% | 905,135 | 7.1% |
[ 21.0% - 21.5% ] 21.15% | 468,789 | 7.6% |
[ 21.5% - 22.0% ] 21.83% | 328,568 | 7.6% |
[ 22.0% - 22.5% ] 22.26% | 1,196,011 | 6.8% |
[ 22.5% - 23.0% ] 22.74% | 930,165 | 8.7% |
[ 23.0% - 23.5% ] 23.27% | 589,308 | 8.3% |
[ 23.5% - 24.0% ] 23.66% | 303,329 | 5.5% |
[ 24.0% - 24.5% ] 24.26% | 449,320 | 8.7% |
[ 24.5% - 25.0% ] 24.65% | 412,896 | 7.7% |
[ 25.0% - 25.5% ] 25.33% | 694,956 | 6.3% |
[ 25.5% - 26.0% ] 25.78% | 768,810 | 10.0% |
[ 26.0% - 26.5% ] 26.23% | 647,923 | 10.5% |
[ 26.5% - 27.0% ] 26.83% | 589,428 | 7.5% |
[ 27.0% - 27.5% ] 27.32% | 513,451 | 14.4% |
[ 27.5% - 28.0% ] 27.78% | 294,425 | 6.5% |
[ 28.0% - 28.5% ] 28.14% | 381,069 | 7.1% |
[ 28.5% - 29.0% ] 28.82% | 558,100 | 11.0% |
[ 29.0% - 29.5% ] 29.23% | 336,012 | 10.8% |
[ 29.5% - 30.0% ] 29.76% | 652,605 | 5.5% |
[ 30.0% - 30.5% ] 30.34% | 494,202 | 6.4% |
[ 30.5% - 31.0% ] 30.66% | 208,179 | 8.1% |
[ 31.0% - 31.5% ] 31.23% | 308,273 | 6.5% |
[ 31.5% - 32.0% ] 31.73% | 289,639 | 7.9% |
[ 32.0% - 32.5% ] 32.38% | 172,084 | 9.5% |
[ 32.5% - 33.0% ] 32.73% | 254,610 | 6.1% |
[ 33.0% - 33.5% ] 33.25% | 324,690 | 6.6% |
[ 33.5% - 34.0% ] 33.67% | 417,832 | 15.1% |
[ 34.0% - 34.5% ] 34.05% | 95,390 | 4.2% |
[ 34.5% - 35.0% ] 34.80% | 1,174,074 | 4.5% |
[ 35.0% - 35.5% ] 35.24% | 300,777 | 5.8% |
[ 35.5% - 36.0% ] 35.70% | 433,238 | 9.5% |
[ 36.0% - 36.5% ] 36.32% | 61,453 | 5.3% |
[ 36.5% - 37.0% ] 36.73% | 330,796 | 5.9% |
[ 37.0% - 37.5% ] 37.29% | 465,400 | 5.5% |
[ 37.5% - 38.0% ] 37.78% | 411,158 | 5.7% |
[ 38.0% - 38.5% ] 38.17% | 1,323,027 | 6.5% |
[ 38.5% - 39.0% ] 38.81% | 132,355 | 11.5% |
[ 39.0% - 39.5% ] 39.48% | 238,953 | 9.9% |
[ 39.5% - 40.0% ] 39.89% | 269,807 | 3.6% |
[ 40.5% - 41.0% ] 40.75% | 140,496 | 2.1% |
[ 41.0% - 41.5% ] 41.20% | 211,734 | 7.6% |
[ 41.5% - 42.0% ] 41.68% | 485,490 | 5.0% |
[ 42.0% - 42.5% ] 42.12% | 111,041 | 10.5% |
[ 42.5% - 43.0% ] 42.86% | 153,564 | 7.2% |
[ 43.0% - 43.5% ] 43.30% | 259,336 | 6.7% |
[ 43.5% - 44.0% ] 43.84% | 193,285 | 10.9% |
[ 44.0% - 44.5% ] 44.32% | 318,475 | 8.2% |
[ 44.5% - 45.0% ] 44.95% | 47,549 | 5.3% |
[ 45.0% - 45.5% ] 45.22% | 60,206 | 6.0% |
[ 46.0% - 46.5% ] 46.23% | 73,255 | 6.8% |
[ 46.5% - 47.0% ] 46.73% | 117,575 | 6.1% |
[ 47.0% - 47.5% ] 47.21% | 155,481 | 4.1% |
[ 47.5% - 48.0% ] 47.77% | 76,689 | 2.9% |
[ 48.0% - 48.5% ] 48.11% | 192,251 | 7.8% |
[ 48.5% - 49.0% ] 48.73% | 95,116 | 9.9% |
[ 49.0% - 49.5% ] 49.16% | 216,366 | 7.4% |
[ 49.5% - 50.0% ] 49.62% | 188,060 | 5.5% |
[ 50.0% - 50.5% ] 50.33% | 149,556 | 4.4% |
[ 50.5% - 51.0% ] 50.75% | 216,210 | 15.0% |
[ 51.0% - 51.5% ] 51.30% | 139,646 | 10.0% |
[ 51.5% - 52.0% ] 51.84% | 37,022 | 8.1% |
[ 52.0% - 52.5% ] 52.30% | 421,392 | 7.2% |
[ 52.5% - 53.0% ] 52.58% | 74,866 | 14.6% |
[ 53.0% - 53.5% ] 53.40% | 175,351 | 6.0% |
[ 53.5% - 54.0% ] 53.86% | 68,793 | 6.9% |
[ 54.0% - 54.5% ] 54.41% | 99,428 | 5.5% |
[ 54.5% - 55.0% ] 54.66% | 41,736 | 13.4% |
[ 55.5% - 56.0% ] 55.84% | 139,004 | 2.4% |
[ 56.5% - 57.0% ] 56.73% | 21,402 | 4.6% |
[ 57.0% - 57.5% ] 57.24% | 25,902 | 3.5% |
[ 57.5% - 58.0% ] 57.83% | 66,247 | 11.5% |
[ 58.0% - 58.5% ] 58.25% | 130,857 | 5.1% |
[ 58.5% - 59.0% ] 58.77% | 195,556 | 4.9% |
[ 59.0% - 59.5% ] 59.39% | 54,534 | 1.3% |
[ 59.5% - 60.0% ] 59.77% | 43,851 | 5.7% |
[ 60.0% - 60.5% ] 60.24% | 153,072 | 5.7% |
[ 60.5% - 61.0% ] 60.60% | 153,666 | 4.8% |
[ 61.0% - 61.5% ] 61.34% | 95,130 | 5.9% |
[ 61.5% - 62.0% ] 61.81% | 265,452 | 6.3% |
[ 62.0% - 62.5% ] 62.33% | 6,238 | 14.1% |
[ 62.5% - 63.0% ] 62.67% | 72,605 | 8.1% |
[ 63.0% - 63.5% ] 63.33% | 56,910 | 13.4% |
[ 63.5% - 64.0% ] 63.93% | 59,410 | 11.0% |
[ 64.5% - 65.0% ] 64.82% | 60,386 | 4.0% |
[ 65.0% - 65.5% ] 65.36% | 81,174 | 6.5% |
[ 65.5% - 66.0% ] 65.88% | 28,212 | 9.8% |
[ 67.0% - 67.5% ] 67.23% | 39,873 | 9.5% |
[ 68.5% - 69.0% ] 68.56% | 39,565 | 14.5% |
[ 69.5% - 70.0% ] 69.85% | 219,899 | 1.4% |
[ 70.0% - 70.5% ] 70.17% | 59,763 | 1.5% |
[ 70.5% - 71.0% ] 70.74% | 57,753 | 8.5% |
[ 72.5% - 73.0% ] 72.64% | 79,495 | 10.9% |
[ 77.0% - 77.5% ] 77.32% | 53,464 | 6.2% |