Asian Disability Age Under 5
COMPARE
Asian
Select to Compare
Disability Age Under 5
Asian Disability Age Under 5
1.1%
DISABILITY | AGE UNDER 5
99.6/ 100
METRIC RATING
53rd/ 347
METRIC RANK
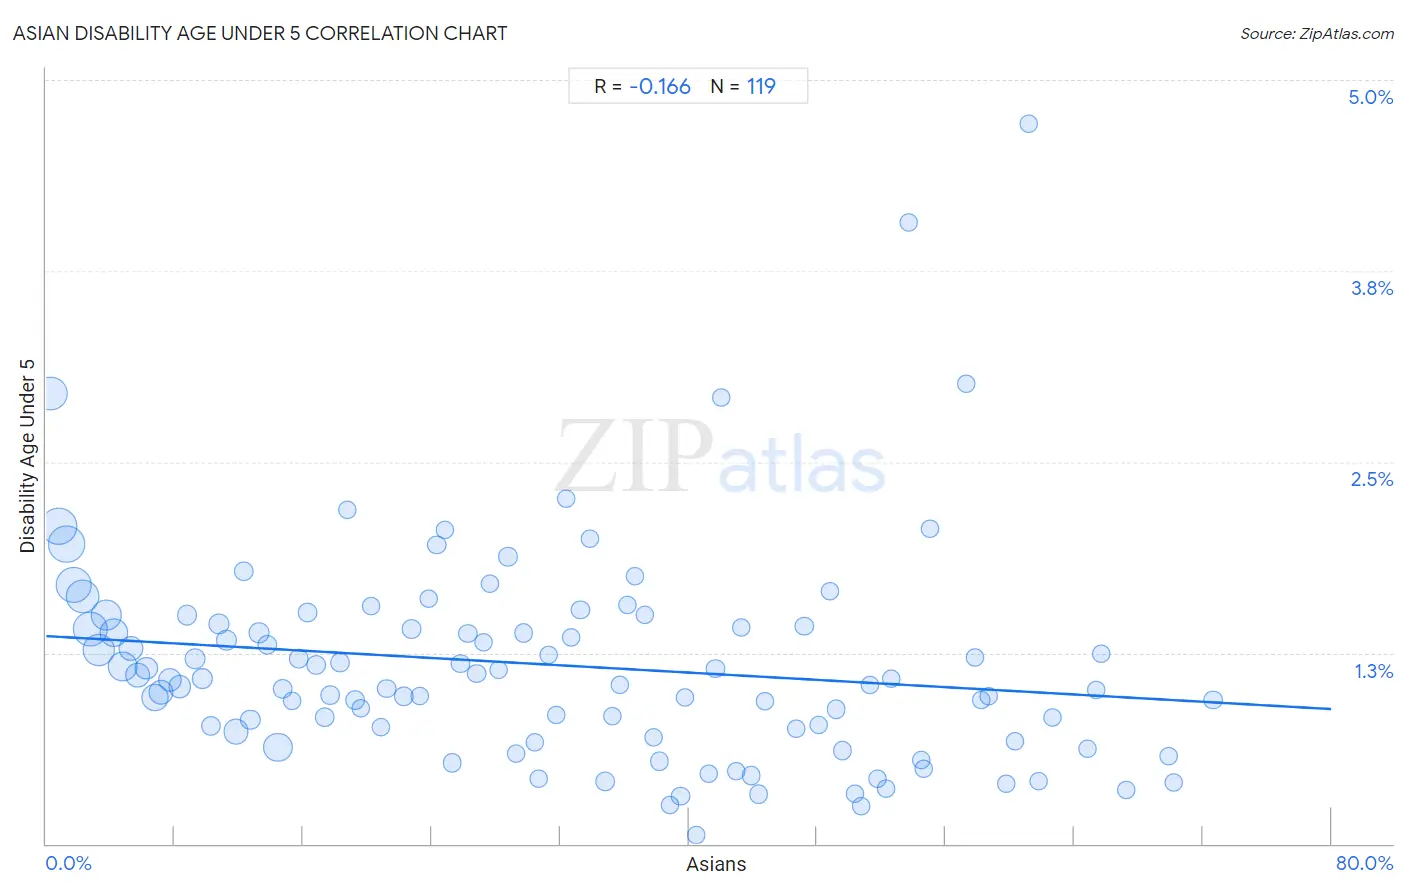
Asian Disability Age Under 5 Correlation Chart
The statistical analysis conducted on geographies consisting of 258,933,212 people shows a poor negative correlation between the proportion of Asians and percentage of population with a disability under the age of 5 in the United States with a correlation coefficient (R) of -0.166 and weighted average of 1.1%. On average, for every 1% (one percent) increase in Asians within a typical geography, there is a decrease of 0.0060% in percentage of population with a disability under the age of 5.
It is essential to understand that the correlation between the percentage of Asians and percentage of population with a disability under the age of 5 does not imply a direct cause-and-effect relationship. It remains uncertain whether the presence of Asians influences an upward or downward trend in the level of percentage of population with a disability under the age of 5 within an area, or if Asians simply ended up residing in those areas with higher or lower levels of percentage of population with a disability under the age of 5 due to other factors.
Demographics Similar to Asians by Disability Age Under 5
In terms of disability age under 5, the demographic groups most similar to Asians are Immigrants from El Salvador (1.1%, a difference of 0.29%), Immigrants from Bolivia (1.1%, a difference of 0.31%), Salvadoran (1.1%, a difference of 0.38%), Immigrants from Kazakhstan (1.1%, a difference of 0.74%), and Ecuadorian (1.1%, a difference of 0.78%).
| Demographics | Rating | Rank | Disability Age Under 5 |
| Immigrants from Congo | 99.8 /100 | #46 | Exceptional 1.1% |
| Immigrants from Sweden | 99.8 /100 | #47 | Exceptional 1.1% |
| Immigrants from Singapore | 99.7 /100 | #48 | Exceptional 1.1% |
| Immigrants from Russia | 99.7 /100 | #49 | Exceptional 1.1% |
| Immigrants from Japan | 99.7 /100 | #50 | Exceptional 1.1% |
| Immigrants from Kazakhstan | 99.7 /100 | #51 | Exceptional 1.1% |
| Immigrants from Bolivia | 99.6 /100 | #52 | Exceptional 1.1% |
| Asians | 99.6 /100 | #53 | Exceptional 1.1% |
| Immigrants from El Salvador | 99.6 /100 | #54 | Exceptional 1.1% |
| Salvadorans | 99.5 /100 | #55 | Exceptional 1.1% |
| Ecuadorians | 99.5 /100 | #56 | Exceptional 1.1% |
| Assyrians/Chaldeans/Syriacs | 99.5 /100 | #57 | Exceptional 1.1% |
| Immigrants from Egypt | 99.4 /100 | #58 | Exceptional 1.1% |
| Immigrants from Malaysia | 99.4 /100 | #59 | Exceptional 1.1% |
| Immigrants from Western Asia | 99.2 /100 | #60 | Exceptional 1.1% |
Asian Disability Age Under 5 Correlation Summary
| Measurement | Asian Data | Disability Age Under 5 Data |
| Minimum | 0.26% | 0.058% |
| Maximum | 72.6% | 4.7% |
| Range | 72.4% | 4.7% |
| Mean | 31.6% | 1.2% |
| Median | 30.4% | 1.1% |
| Interquartile 25% (IQ1) | 14.7% | 0.73% |
| Interquartile 75% (IQ3) | 48.1% | 1.4% |
| Interquartile Range (IQR) | 33.4% | 0.69% |
| Standard Deviation (Sample) | 19.5% | 0.71% |
| Standard Deviation (Population) | 19.5% | 0.70% |
Correlation Details
| Asian Percentile | Sample Size | Disability Age Under 5 |
[ 0.0% - 0.5% ] 0.26% | 15,596,349 | 2.9% |
[ 0.5% - 1.0% ] 0.75% | 18,855,704 | 2.1% |
[ 1.0% - 1.5% ] 1.27% | 18,133,643 | 2.0% |
[ 1.5% - 2.0% ] 1.74% | 17,736,000 | 1.7% |
[ 2.0% - 2.5% ] 2.25% | 14,821,420 | 1.6% |
[ 2.5% - 3.0% ] 2.73% | 15,719,464 | 1.4% |
[ 3.0% - 3.5% ] 3.24% | 13,776,456 | 1.3% |
[ 3.5% - 4.0% ] 3.71% | 12,520,326 | 1.5% |
[ 4.0% - 4.5% ] 4.20% | 9,742,860 | 1.4% |
[ 4.5% - 5.0% ] 4.74% | 10,969,957 | 1.2% |
[ 5.0% - 5.5% ] 5.26% | 6,891,599 | 1.3% |
[ 5.5% - 6.0% ] 5.72% | 5,995,811 | 1.1% |
[ 6.0% - 6.5% ] 6.23% | 4,824,970 | 1.1% |
[ 6.5% - 7.0% ] 6.78% | 8,737,880 | 0.95% |
[ 7.0% - 7.5% ] 7.13% | 6,778,070 | 0.99% |
[ 7.5% - 8.0% ] 7.68% | 5,228,343 | 1.1% |
[ 8.0% - 8.5% ] 8.30% | 4,330,781 | 1.0% |
[ 8.5% - 9.0% ] 8.77% | 2,241,514 | 1.5% |
[ 9.0% - 9.5% ] 9.26% | 2,407,612 | 1.2% |
[ 9.5% - 10.0% ] 9.74% | 2,873,635 | 1.1% |
[ 10.0% - 10.5% ] 10.25% | 1,935,361 | 0.77% |
[ 10.5% - 11.0% ] 10.76% | 2,178,222 | 1.4% |
[ 11.0% - 11.5% ] 11.24% | 2,140,672 | 1.3% |
[ 11.5% - 12.0% ] 11.80% | 6,804,279 | 0.73% |
[ 12.0% - 12.5% ] 12.29% | 1,242,480 | 1.8% |
[ 12.5% - 13.0% ] 12.71% | 1,855,990 | 0.81% |
[ 13.0% - 13.5% ] 13.25% | 1,944,349 | 1.4% |
[ 13.5% - 14.0% ] 13.75% | 1,688,476 | 1.3% |
[ 14.0% - 14.5% ] 14.43% | 10,406,458 | 0.63% |
[ 14.5% - 15.0% ] 14.73% | 976,015 | 1.0% |
[ 15.0% - 15.5% ] 15.31% | 764,054 | 0.94% |
[ 15.5% - 16.0% ] 15.75% | 1,365,880 | 1.2% |
[ 16.0% - 16.5% ] 16.23% | 1,187,343 | 1.5% |
[ 16.5% - 17.0% ] 16.81% | 1,371,305 | 1.2% |
[ 17.0% - 17.5% ] 17.32% | 1,866,812 | 0.83% |
[ 17.5% - 18.0% ] 17.68% | 1,003,656 | 0.97% |
[ 18.0% - 18.5% ] 18.31% | 1,225,170 | 1.2% |
[ 18.5% - 19.0% ] 18.72% | 338,681 | 2.2% |
[ 19.0% - 19.5% ] 19.21% | 1,059,685 | 0.94% |
[ 19.5% - 20.0% ] 19.59% | 971,610 | 0.89% |
[ 20.0% - 20.5% ] 20.25% | 342,327 | 1.6% |
[ 20.5% - 21.0% ] 20.85% | 712,950 | 0.76% |
[ 21.0% - 21.5% ] 21.20% | 428,841 | 1.0% |
[ 22.0% - 22.5% ] 22.26% | 1,104,602 | 0.96% |
[ 22.5% - 23.0% ] 22.73% | 693,546 | 1.4% |
[ 23.0% - 23.5% ] 23.24% | 495,137 | 0.97% |
[ 23.5% - 24.0% ] 23.81% | 155,451 | 1.6% |
[ 24.0% - 24.5% ] 24.31% | 261,527 | 2.0% |
[ 24.5% - 25.0% ] 24.81% | 185,999 | 2.1% |
[ 25.0% - 25.5% ] 25.29% | 594,164 | 0.53% |
[ 25.5% - 26.0% ] 25.79% | 241,772 | 1.2% |
[ 26.0% - 26.5% ] 26.26% | 539,714 | 1.4% |
[ 26.5% - 27.0% ] 26.79% | 494,350 | 1.1% |
[ 27.0% - 27.5% ] 27.22% | 426,764 | 1.3% |
[ 27.5% - 28.0% ] 27.60% | 107,847 | 1.7% |
[ 28.0% - 28.5% ] 28.15% | 310,849 | 1.1% |
[ 28.5% - 29.0% ] 28.74% | 358,205 | 1.9% |
[ 29.0% - 29.5% ] 29.26% | 334,222 | 0.59% |
[ 29.5% - 30.0% ] 29.72% | 339,131 | 1.4% |
[ 30.0% - 30.5% ] 30.41% | 380,816 | 0.66% |
[ 30.5% - 31.0% ] 30.65% | 178,258 | 0.42% |
[ 31.0% - 31.5% ] 31.28% | 213,819 | 1.2% |
[ 31.5% - 32.0% ] 31.77% | 25,631 | 0.85% |
[ 32.0% - 32.5% ] 32.38% | 145,381 | 2.3% |
[ 32.5% - 33.0% ] 32.66% | 201,526 | 1.4% |
[ 33.0% - 33.5% ] 33.25% | 344,700 | 1.5% |
[ 33.5% - 34.0% ] 33.85% | 150,989 | 2.0% |
[ 34.5% - 35.0% ] 34.80% | 970,044 | 0.41% |
[ 35.0% - 35.5% ] 35.27% | 206,504 | 0.84% |
[ 35.5% - 36.0% ] 35.73% | 324,483 | 1.0% |
[ 36.0% - 36.5% ] 36.21% | 101,111 | 1.6% |
[ 36.5% - 37.0% ] 36.64% | 157,021 | 1.8% |
[ 37.0% - 37.5% ] 37.26% | 362,716 | 1.5% |
[ 37.5% - 38.0% ] 37.81% | 319,831 | 0.70% |
[ 38.0% - 38.5% ] 38.17% | 1,222,984 | 0.54% |
[ 38.5% - 39.0% ] 38.80% | 48,140 | 0.25% |
[ 39.0% - 39.5% ] 39.49% | 186,099 | 0.31% |
[ 39.5% - 40.0% ] 39.75% | 70,458 | 0.96% |
[ 40.0% - 40.5% ] 40.44% | 29,544 | 0.058% |
[ 41.0% - 41.5% ] 41.24% | 77,245 | 0.46% |
[ 41.5% - 42.0% ] 41.66% | 328,727 | 1.1% |
[ 42.0% - 42.5% ] 42.03% | 38,328 | 2.9% |
[ 42.5% - 43.0% ] 42.95% | 106,408 | 0.47% |
[ 43.0% - 43.5% ] 43.23% | 46,424 | 1.4% |
[ 43.5% - 44.0% ] 43.86% | 162,084 | 0.45% |
[ 44.0% - 44.5% ] 44.34% | 322,131 | 0.32% |
[ 44.5% - 45.0% ] 44.77% | 107,002 | 0.93% |
[ 46.5% - 47.0% ] 46.71% | 131,856 | 0.76% |
[ 47.0% - 47.5% ] 47.20% | 163,898 | 1.4% |
[ 48.0% - 48.5% ] 48.11% | 168,804 | 0.78% |
[ 48.5% - 49.0% ] 48.80% | 116,347 | 1.6% |
[ 49.0% - 49.5% ] 49.16% | 216,366 | 0.88% |
[ 49.5% - 50.0% ] 49.59% | 154,573 | 0.61% |
[ 50.0% - 50.5% ] 50.33% | 149,556 | 0.33% |
[ 50.5% - 51.0% ] 50.74% | 181,268 | 0.25% |
[ 51.0% - 51.5% ] 51.28% | 82,295 | 1.0% |
[ 51.5% - 52.0% ] 51.75% | 62,370 | 0.43% |
[ 52.0% - 52.5% ] 52.30% | 348,547 | 0.36% |
[ 52.5% - 53.0% ] 52.58% | 74,866 | 1.1% |
[ 53.5% - 54.0% ] 53.72% | 110,386 | 4.1% |
[ 54.0% - 54.5% ] 54.45% | 66,215 | 0.54% |
[ 54.5% - 55.0% ] 54.62% | 46,812 | 0.49% |
[ 55.0% - 55.5% ] 55.01% | 33,367 | 2.1% |
[ 57.0% - 57.5% ] 57.24% | 25,902 | 3.0% |
[ 57.5% - 58.0% ] 57.83% | 66,247 | 1.2% |
[ 58.0% - 58.5% ] 58.22% | 24,444 | 0.94% |
[ 58.5% - 59.0% ] 58.70% | 114,530 | 0.96% |
[ 59.5% - 60.0% ] 59.77% | 43,851 | 0.39% |
[ 60.0% - 60.5% ] 60.34% | 81,146 | 0.67% |
[ 61.0% - 61.5% ] 61.19% | 66,089 | 4.7% |
[ 61.5% - 62.0% ] 61.81% | 265,452 | 0.41% |
[ 62.5% - 63.0% ] 62.67% | 72,605 | 0.83% |
[ 64.5% - 65.0% ] 64.82% | 60,386 | 0.62% |
[ 65.0% - 65.5% ] 65.37% | 76,933 | 1.0% |
[ 65.5% - 66.0% ] 65.67% | 64,377 | 1.2% |
[ 67.0% - 67.5% ] 67.23% | 39,873 | 0.35% |
[ 69.5% - 70.0% ] 69.85% | 219,899 | 0.58% |
[ 70.0% - 70.5% ] 70.17% | 59,763 | 0.40% |
[ 72.5% - 73.0% ] 72.64% | 79,495 | 0.94% |