Samoan Receiving Food Stamps
COMPARE
Samoan
Select to Compare
Receiving Food Stamps
Samoan Receiving Food Stamps
12.1%
PUBLIC INCOME | FOOD STAMPS
31.0/ 100
METRIC RATING
192nd/ 347
METRIC RANK
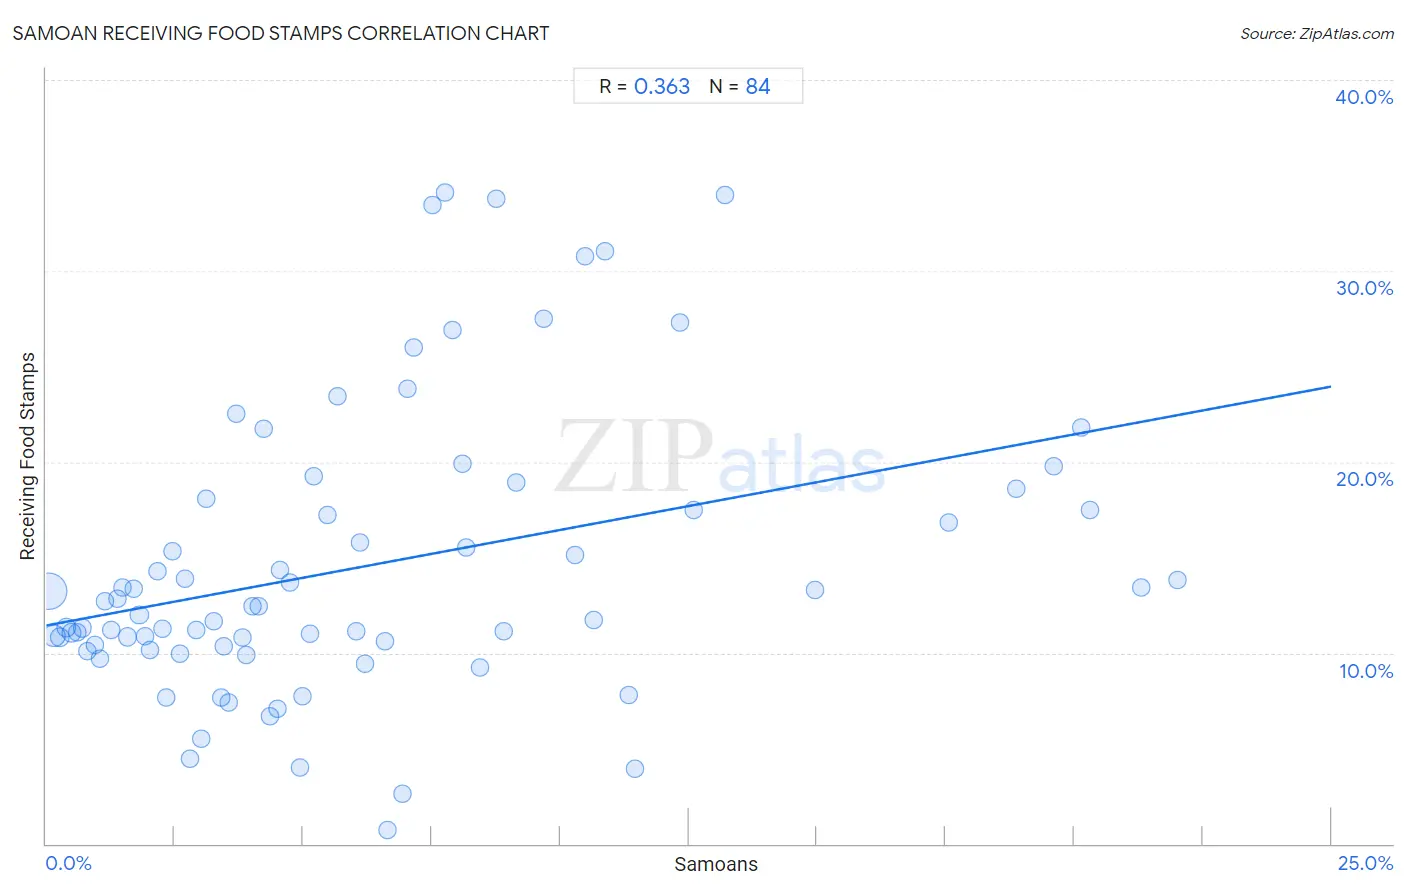
Samoan Receiving Food Stamps Correlation Chart
The statistical analysis conducted on geographies consisting of 224,983,999 people shows a mild positive correlation between the proportion of Samoans and percentage of population receiving government assistance and/or food stamps in the United States with a correlation coefficient (R) of 0.363 and weighted average of 12.1%. On average, for every 1% (one percent) increase in Samoans within a typical geography, there is an increase of 0.50% in percentage of population receiving government assistance and/or food stamps.
It is essential to understand that the correlation between the percentage of Samoans and percentage of population receiving government assistance and/or food stamps does not imply a direct cause-and-effect relationship. It remains uncertain whether the presence of Samoans influences an upward or downward trend in the level of percentage of population receiving government assistance and/or food stamps within an area, or if Samoans simply ended up residing in those areas with higher or lower levels of percentage of population receiving government assistance and/or food stamps due to other factors.
Demographics Similar to Samoans by Receiving Food Stamps
In terms of receiving food stamps, the demographic groups most similar to Samoans are Venezuelan (12.0%, a difference of 0.18%), Immigrants from Peru (12.0%, a difference of 0.19%), Immigrants from Cameroon (12.0%, a difference of 0.24%), Sudanese (12.0%, a difference of 0.38%), and Immigrants from Fiji (12.1%, a difference of 0.53%).
| Demographics | Rating | Rank | Receiving Food Stamps |
| Immigrants from Iraq | 37.1 /100 | #185 | Fair 12.0% |
| Spanish | 36.9 /100 | #186 | Fair 12.0% |
| Albanians | 35.4 /100 | #187 | Fair 12.0% |
| Sudanese | 33.4 /100 | #188 | Fair 12.0% |
| Immigrants from Cameroon | 32.5 /100 | #189 | Fair 12.0% |
| Immigrants from Peru | 32.2 /100 | #190 | Fair 12.0% |
| Venezuelans | 32.1 /100 | #191 | Fair 12.0% |
| Samoans | 31.0 /100 | #192 | Fair 12.1% |
| Immigrants from Fiji | 27.8 /100 | #193 | Fair 12.1% |
| Immigrants from Sudan | 27.1 /100 | #194 | Fair 12.1% |
| Americans | 26.7 /100 | #195 | Fair 12.2% |
| Iraqis | 26.6 /100 | #196 | Fair 12.2% |
| Delaware | 26.1 /100 | #197 | Fair 12.2% |
| Immigrants from Costa Rica | 25.4 /100 | #198 | Fair 12.2% |
| Portuguese | 25.1 /100 | #199 | Fair 12.2% |
Samoan Receiving Food Stamps Correlation Summary
| Measurement | Samoan Data | Receiving Food Stamps Data |
| Minimum | 0.040% | 0.70% |
| Maximum | 22.0% | 34.1% |
| Range | 22.0% | 33.4% |
| Mean | 6.3% | 14.6% |
| Median | 4.6% | 12.4% |
| Interquartile 25% (IQ1) | 2.3% | 10.4% |
| Interquartile 75% (IQ3) | 8.6% | 17.8% |
| Interquartile Range (IQR) | 6.3% | 7.4% |
| Standard Deviation (Sample) | 5.4% | 7.5% |
| Standard Deviation (Population) | 5.4% | 7.5% |
Correlation Details
| Samoan Percentile | Sample Size | Receiving Food Stamps |
[ 0.0% - 0.5% ] 0.040% | 145,324,969 | 13.3% |
[ 0.0% - 0.5% ] 0.15% | 35,677,281 | 10.9% |
[ 0.0% - 0.5% ] 0.26% | 12,927,755 | 10.8% |
[ 0.0% - 0.5% ] 0.38% | 8,658,518 | 11.3% |
[ 0.0% - 0.5% ] 0.49% | 5,640,988 | 11.0% |
[ 0.5% - 1.0% ] 0.60% | 3,152,379 | 11.1% |
[ 0.5% - 1.0% ] 0.71% | 2,400,997 | 11.3% |
[ 0.5% - 1.0% ] 0.81% | 2,038,313 | 10.1% |
[ 0.5% - 1.0% ] 0.94% | 1,418,584 | 10.4% |
[ 1.0% - 1.5% ] 1.05% | 1,088,108 | 9.7% |
[ 1.0% - 1.5% ] 1.14% | 855,609 | 12.7% |
[ 1.0% - 1.5% ] 1.27% | 685,598 | 11.2% |
[ 1.0% - 1.5% ] 1.38% | 698,682 | 12.9% |
[ 1.0% - 1.5% ] 1.49% | 270,595 | 13.4% |
[ 1.5% - 2.0% ] 1.58% | 439,511 | 10.8% |
[ 1.5% - 2.0% ] 1.71% | 390,439 | 13.4% |
[ 1.5% - 2.0% ] 1.81% | 310,323 | 12.0% |
[ 1.5% - 2.0% ] 1.93% | 257,599 | 10.8% |
[ 2.0% - 2.5% ] 2.02% | 165,009 | 10.1% |
[ 2.0% - 2.5% ] 2.16% | 205,301 | 14.3% |
[ 2.0% - 2.5% ] 2.26% | 446,400 | 11.3% |
[ 2.0% - 2.5% ] 2.35% | 44,337 | 7.7% |
[ 2.0% - 2.5% ] 2.46% | 78,160 | 15.3% |
[ 2.5% - 3.0% ] 2.61% | 373,158 | 9.9% |
[ 2.5% - 3.0% ] 2.69% | 172,844 | 13.9% |
[ 2.5% - 3.0% ] 2.80% | 25,082 | 4.4% |
[ 2.5% - 3.0% ] 2.91% | 60,518 | 11.2% |
[ 3.0% - 3.5% ] 3.02% | 68,537 | 5.5% |
[ 3.0% - 3.5% ] 3.11% | 56,341 | 18.1% |
[ 3.0% - 3.5% ] 3.26% | 103,784 | 11.7% |
[ 3.0% - 3.5% ] 3.40% | 39,480 | 7.7% |
[ 3.0% - 3.5% ] 3.47% | 119,589 | 10.3% |
[ 3.5% - 4.0% ] 3.56% | 61,753 | 7.4% |
[ 3.5% - 4.0% ] 3.70% | 51,223 | 22.5% |
[ 3.5% - 4.0% ] 3.82% | 41,455 | 10.8% |
[ 3.5% - 4.0% ] 3.90% | 14,251 | 9.9% |
[ 4.0% - 4.5% ] 4.02% | 27,942 | 12.4% |
[ 4.0% - 4.5% ] 4.13% | 74,292 | 12.4% |
[ 4.0% - 4.5% ] 4.23% | 43,061 | 21.7% |
[ 4.0% - 4.5% ] 4.36% | 17,867 | 6.7% |
[ 4.0% - 4.5% ] 4.49% | 5,905 | 7.1% |
[ 4.5% - 5.0% ] 4.55% | 13,705 | 14.4% |
[ 4.5% - 5.0% ] 4.75% | 1,707 | 13.7% |
[ 4.5% - 5.0% ] 4.93% | 365 | 4.0% |
[ 4.5% - 5.0% ] 4.99% | 28,173 | 7.7% |
[ 5.0% - 5.5% ] 5.13% | 36,331 | 11.0% |
[ 5.0% - 5.5% ] 5.21% | 56,160 | 19.3% |
[ 5.0% - 5.5% ] 5.47% | 25,427 | 17.2% |
[ 5.5% - 6.0% ] 5.67% | 8,205 | 23.4% |
[ 6.0% - 6.5% ] 6.04% | 72,324 | 11.1% |
[ 6.0% - 6.5% ] 6.11% | 229 | 15.8% |
[ 6.0% - 6.5% ] 6.21% | 11,276 | 9.4% |
[ 6.5% - 7.0% ] 6.60% | 2,122 | 10.6% |
[ 6.5% - 7.0% ] 6.65% | 7,551 | 0.70% |
[ 6.5% - 7.0% ] 6.93% | 101 | 2.6% |
[ 7.0% - 7.5% ] 7.04% | 696 | 23.8% |
[ 7.0% - 7.5% ] 7.14% | 5,743 | 26.0% |
[ 7.5% - 8.0% ] 7.51% | 17,628 | 33.4% |
[ 7.5% - 8.0% ] 7.76% | 2,564 | 34.1% |
[ 7.5% - 8.0% ] 7.90% | 51,367 | 26.9% |
[ 8.0% - 8.5% ] 8.11% | 3,909 | 19.9% |
[ 8.0% - 8.5% ] 8.17% | 465 | 15.5% |
[ 8.0% - 8.5% ] 8.44% | 237 | 9.2% |
[ 8.5% - 9.0% ] 8.74% | 10,042 | 33.8% |
[ 8.5% - 9.0% ] 8.91% | 3,188 | 11.1% |
[ 9.0% - 9.5% ] 9.14% | 38,142 | 18.9% |
[ 9.5% - 10.0% ] 9.67% | 331 | 27.5% |
[ 10.0% - 10.5% ] 10.30% | 4,555 | 15.1% |
[ 10.0% - 10.5% ] 10.49% | 391 | 30.8% |
[ 10.5% - 11.0% ] 10.66% | 6,606 | 11.7% |
[ 10.5% - 11.0% ] 10.88% | 377 | 31.0% |
[ 11.0% - 11.5% ] 11.33% | 256 | 7.8% |
[ 11.0% - 11.5% ] 11.46% | 759 | 3.9% |
[ 12.0% - 12.5% ] 12.32% | 138 | 27.3% |
[ 12.5% - 13.0% ] 12.61% | 3,593 | 17.5% |
[ 13.0% - 13.5% ] 13.21% | 12,370 | 34.0% |
[ 14.5% - 15.0% ] 14.96% | 341 | 13.3% |
[ 17.5% - 18.0% ] 17.56% | 5,713 | 16.8% |
[ 18.5% - 19.0% ] 18.88% | 1,070 | 18.6% |
[ 19.5% - 20.0% ] 19.60% | 1,949 | 19.8% |
[ 20.0% - 20.5% ] 20.14% | 1,897 | 21.8% |
[ 20.0% - 20.5% ] 20.32% | 2,274 | 17.5% |
[ 21.0% - 21.5% ] 21.30% | 5,774 | 13.4% |
[ 22.0% - 22.5% ] 22.01% | 5,411 | 13.8% |