Samoan Unemployment Among Women with Children Ages 6 to 17 years

COMPARE

Samoan
Race
Ancestry
AfghanAfricanAlaska NativeAlaskan AthabascanAlbanianAleutAlsatianAmericanApacheArabArapahoArgentineanArmenianAssyrian/Chaldean/SyriacAustralianAustrianBahamianBangladeshiBarbadianBasqueBelgianBelizeanBermudanBhutaneseBlackfeetBolivianBrazilianBritishBritish West IndianBulgarianBurmeseCajunCambodianCanadianCape VerdeanCarpatho RusynCelticCentral AmericanCentral American IndianCherokeeCheyenneChickasawChileanChineseChippewaChoctawColombianColvilleComancheCosta RicanCreeCreekCroatianCrowCubanCypriotCzechCzechoslovakianDanishDelawareDominicanDutchDutch West IndianEastern EuropeanEcuadorianEgyptianEnglishEstonianEthiopianEuropeanFijianFilipinoFinnishFrenchFrench American IndianFrench CanadianGermanGerman RussianGhanaianGreekGuamanian/ChamorroGuatemalanGuyaneseHaitianHmongHonduranHopiHoumaHungarianIcelanderIndian (Asian)IndonesianInupiatIranianIraqiIrishIroquoisIsraeliItalianJamaicanJapaneseJordanianKenyanKiowaKoreanLaotianLatvianLebaneseLiberianLithuanianLumbeeLuxembourgerMacedonianMalaysianMalteseMarshalleseMenomineeMexicanMexican American IndianMongolianMoroccanNative HawaiianNavajoNepaleseNew ZealanderNicaraguanNigerianNorthern EuropeanNorwegianOkinawanOsageOttawaPaiutePakistaniPalestinianPanamanianParaguayanPennsylvania GermanPeruvianPimaPolishPortuguesePotawatomiPuebloPuerto RicanPuget Sound SalishRomanianRussianSalvadoranSamoanScandinavianScotch-IrishScottishSeminoleSenegaleseSerbianShoshoneSierra LeoneanSiouxSlavicSlovakSloveneSomaliSouth AfricanSouth AmericanSouth American IndianSoviet UnionSpaniardSpanishSpanish AmericanSpanish American IndianSri LankanSubsaharan AfricanSudaneseSwedishSwissSyrianTaiwaneseThaiTlingit-HaidaTohono O'OdhamTonganTrinidadian and TobagonianTsimshianTurkishU.S. Virgin IslanderUgandanUkrainianUruguayanUteVenezuelanVietnameseWelshWest IndianYakamaYaquiYugoslavianYumanYup'ikZimbabwean
Immigration
NonimmigrantsImmigrantsAfghanistanAfricaAlbaniaArgentinaArmeniaAsiaAustraliaAustriaBahamasBangladeshBarbadosBelarusBelgiumBelizeBoliviaBosnia and HerzegovinaBrazilBulgariaBurma/MyanmarCabo VerdeCambodiaCameroonCanadaCaribbeanCentral AmericaChileChinaColombiaCongoCosta RicaCroatiaCubaCzechoslovakiaDenmarkDominicaDominican RepublicEastern AfricaEastern AsiaEastern EuropeEcuadorEgyptEl SalvadorEnglandEritreaEthiopiaEuropeFijiFranceGermanyGhanaGreeceGrenadaGuatemalaGuyanaHaitiHondurasHong KongHungaryIndiaIndonesiaIranIraqIrelandIsraelItalyJamaicaJapanJordanKazakhstanKenyaKoreaKuwaitLaosLatin AmericaLatviaLebanonLiberiaLithuaniaMalaysiaMexicoMicronesiaMiddle AfricaMoldovaMoroccoNepalNetherlandsNicaraguaNigeriaNorth AmericaNorth MacedoniaNorthern AfricaNorthern EuropeNorwayOceaniaPakistanPanamaPeruPhilippinesPolandPortugalRomaniaRussiaSaudi ArabiaScotlandSenegalSerbiaSierra LeoneSingaporeSomaliaSouth AfricaSouth AmericaSouth Central AsiaSouth Eastern AsiaSouthern EuropeSpainSri LankaSt. Vincent and the GrenadinesSudanSwedenSwitzerlandSyriaTaiwanThailandTrinidad and TobagoTurkeyUgandaUkraineUruguayUzbekistanVenezuelaVietnamWest IndiesWestern AfricaWestern AsiaWestern EuropeYemenZaireZimbabweAzores
Select to Compare
Race
Ancestry
AfghanAfricanAlaska NativeAlaskan AthabascanAlbanianAleutAlsatianAmericanApacheArabArapahoArgentineanArmenianAssyrian/Chaldean/SyriacAustralianAustrianBahamianBangladeshiBarbadianBasqueBelgianBelizeanBermudanBhutaneseBlackfeetBolivianBrazilianBritishBritish West IndianBulgarianBurmeseCajunCambodianCanadianCape VerdeanCarpatho RusynCelticCentral AmericanCentral American IndianCherokeeCheyenneChickasawChileanChineseChippewaChoctawColombianColvilleComancheCosta RicanCreeCreekCroatianCrowCubanCypriotCzechCzechoslovakianDanishDelawareDominicanDutchDutch West IndianEastern EuropeanEcuadorianEgyptianEnglishEstonianEthiopianEuropeanFijianFilipinoFinnishFrenchFrench American IndianFrench CanadianGermanGerman RussianGhanaianGreekGuamanian/ChamorroGuatemalanGuyaneseHaitianHmongHonduranHopiHoumaHungarianIcelanderIndian (Asian)IndonesianInupiatIranianIraqiIrishIroquoisIsraeliItalianJamaicanJapaneseJordanianKenyanKiowaKoreanLaotianLatvianLebaneseLiberianLithuanianLumbeeLuxembourgerMacedonianMalaysianMalteseMarshalleseMenomineeMexicanMexican American IndianMongolianMoroccanNative HawaiianNavajoNepaleseNew ZealanderNicaraguanNigerianNorthern EuropeanNorwegianOkinawanOsageOttawaPaiutePakistaniPalestinianPanamanianParaguayanPennsylvania GermanPeruvianPimaPolishPortuguesePotawatomiPuebloPuerto RicanPuget Sound SalishRomanianRussianSalvadoranScandinavianScotch-IrishScottishSeminoleSenegaleseSerbianShoshoneSierra LeoneanSiouxSlavicSlovakSloveneSomaliSouth AfricanSouth AmericanSouth American IndianSoviet UnionSpaniardSpanishSpanish AmericanSpanish American IndianSri LankanSubsaharan AfricanSudaneseSwedishSwissSyrianTaiwaneseThaiTlingit-HaidaTohono O'OdhamTonganTrinidadian and TobagonianTsimshianTurkishU.S. Virgin IslanderUgandanUkrainianUruguayanUteVenezuelanVietnameseWelshWest IndianYakamaYaquiYugoslavianYumanYup'ikZimbabwean
Immigration
NonimmigrantsImmigrantsAfghanistanAfricaAlbaniaArgentinaArmeniaAsiaAustraliaAustriaBahamasBangladeshBarbadosBelarusBelgiumBelizeBoliviaBosnia and HerzegovinaBrazilBulgariaBurma/MyanmarCabo VerdeCambodiaCameroonCanadaCaribbeanCentral AmericaChileChinaColombiaCongoCosta RicaCroatiaCubaCzechoslovakiaDenmarkDominicaDominican RepublicEastern AfricaEastern AsiaEastern EuropeEcuadorEgyptEl SalvadorEnglandEritreaEthiopiaEuropeFijiFranceGermanyGhanaGreeceGrenadaGuatemalaGuyanaHaitiHondurasHong KongHungaryIndiaIndonesiaIranIraqIrelandIsraelItalyJamaicaJapanJordanKazakhstanKenyaKoreaKuwaitLaosLatin AmericaLatviaLebanonLiberiaLithuaniaMalaysiaMexicoMicronesiaMiddle AfricaMoldovaMoroccoNepalNetherlandsNicaraguaNigeriaNorth AmericaNorth MacedoniaNorthern AfricaNorthern EuropeNorwayOceaniaPakistanPanamaPeruPhilippinesPolandPortugalRomaniaRussiaSaudi ArabiaScotlandSenegalSerbiaSierra LeoneSingaporeSomaliaSouth AfricaSouth AmericaSouth Central AsiaSouth Eastern AsiaSouthern EuropeSpainSri LankaSt. Vincent and the GrenadinesSudanSwedenSwitzerlandSyriaTaiwanThailandTrinidad and TobagoTurkeyUgandaUkraineUruguayUzbekistanVenezuelaVietnamWest IndiesWestern AfricaWestern AsiaWestern EuropeYemenZaireZimbabweAzores
Unemployment Among Women with Children Ages 6 to 17 years
Income
Poverty
Unemployment
Labor Participation
Family Structure
Vehicle Availability
Education Level
Disability

Samoan Unemployment Among Women with Children Ages 6 to 17 years
Exceptional

8.4%
UNEMPLOYMENT | WOMEN W/ CHILDREN 6 TO 17
99.7/ 100
METRIC RATING
74th/ 347
METRIC RANK

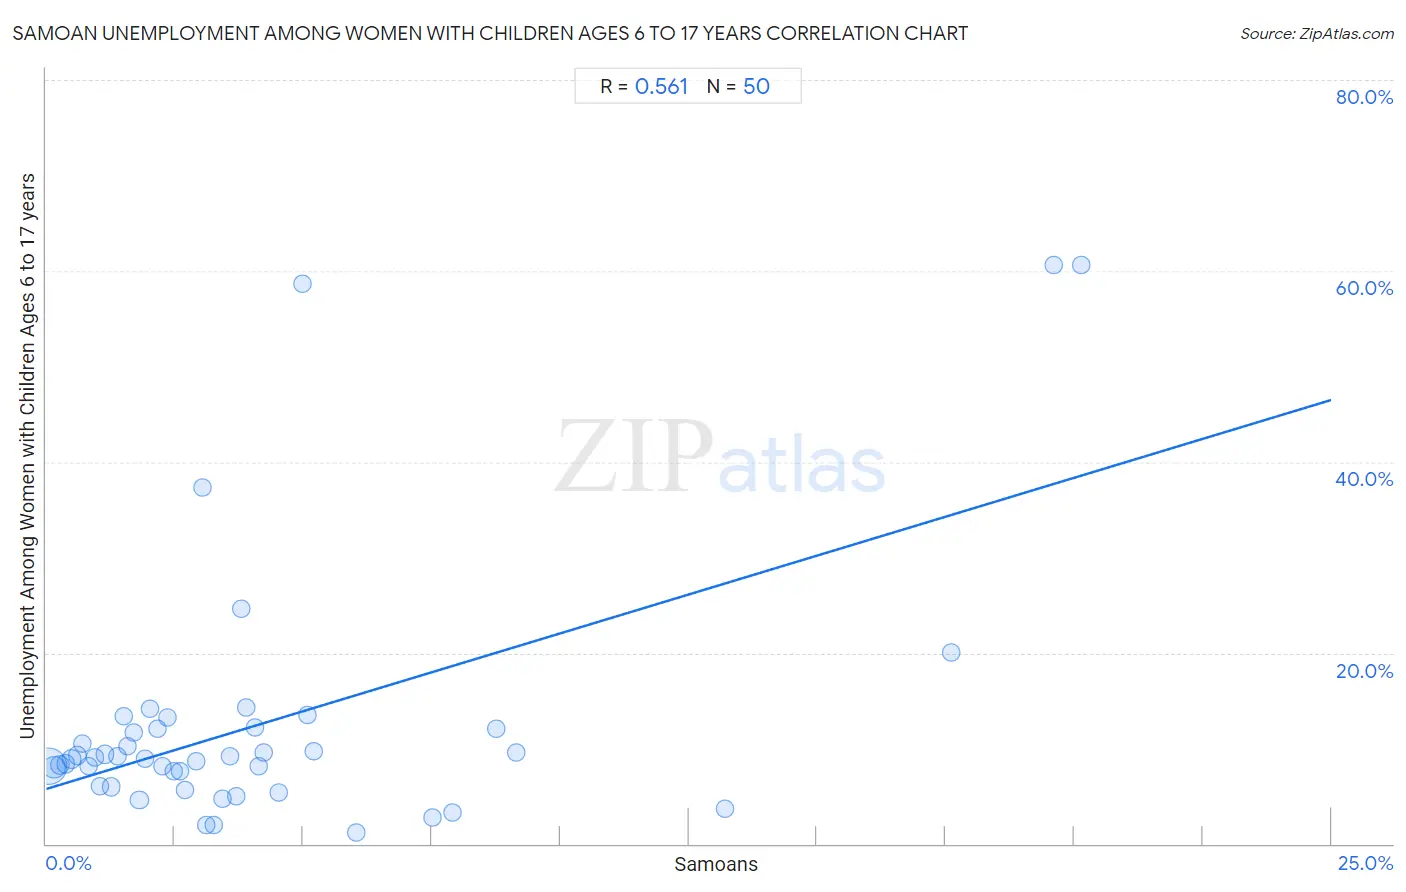
Samoan Unemployment Among Women with Children Ages 6 to 17 years Correlation Chart

The statistical analysis conducted on geographies consisting of 183,981,110 people shows a substantial positive correlation between the proportion of Samoans and unemployment rate among women with children between the ages 6 and 17 in the United States with a correlation coefficient (R) of 0.561 and weighted average of 8.4%. On average, for every 1% (one percent) increase in Samoans within a typical geography, there is an increase of 1.6% in unemployment rate among women with children between the ages 6 and 17.
Samoan Unemployment Among Women with Children Ages 6 to 17 years
It is essential to understand that the correlation between the percentage of Samoans and unemployment rate among women with children between the ages 6 and 17 does not imply a direct cause-and-effect relationship. It remains uncertain whether the presence of Samoans influences an upward or downward trend in the level of unemployment rate among women with children between the ages 6 and 17 within an area, or if Samoans simply ended up residing in those areas with higher or lower levels of unemployment rate among women with children between the ages 6 and 17 due to other factors.

Demographics Similar to Samoans by Unemployment Among Women with Children Ages 6 to 17 years

In terms of unemployment among women with children ages 6 to 17 years, the demographic groups most similar to Samoans are Immigrants from Sri Lanka (8.4%, a difference of 0.080%), Immigrants from Moldova (8.4%, a difference of 0.11%), Iraqi (8.4%, a difference of 0.16%), Pakistani (8.4%, a difference of 0.29%), and Mongolian (8.4%, a difference of 0.30%).
DemographicsRating | RankUnemployment Among Women with Children Ages 6 to 17 years
Armenians
99.9
/100
|
#67
Exceptional
8.3%
Marshallese
99.9
/100
|
#68
Exceptional
8.3%
Immigrants from Thailand
99.9
/100
|
#69
Exceptional
8.3%
Norwegians
99.9
/100
|
#70
Exceptional
8.3%
Immigrants from Australia
99.8
/100
|
#71
Exceptional
8.3%
Immigrants from Nepal
99.8
/100
|
#72
Exceptional
8.3%
Spanish Americans
99.8
/100
|
#73
Exceptional
8.4%
Samoans
99.7
/100
|
#74
Exceptional
8.4%
Immigrants from Sri Lanka
99.7
/100
|
#75
Exceptional
8.4%
Immigrants from Moldova
99.7
/100
|
#76
Exceptional
8.4%
Iraqis
99.7
/100
|
#77
Exceptional
8.4%
Pakistanis
99.6
/100
|
#78
Exceptional
8.4%
Mongolians
99.6
/100
|
#79
Exceptional
8.4%
Immigrants from Belarus
99.6
/100
|
#80
Exceptional
8.4%
Immigrants from Bolivia
99.6
/100
|
#81
Exceptional
8.4%

Samoan Unemployment Among Women with Children Ages 6 to 17 years Correlation Summary

MeasurementSamoan DataUnemployment Among Women with Children Ages 6 to 17 years Data
Minimum0.038%1.2%
Maximum20.1%60.6%
Range20.1%59.4%
Mean4.1%12.5%
Median2.8%9.0%
Interquartile 25% (IQ1)1.4%6.0%
Interquartile 75% (IQ3)4.5%12.0%
Interquartile Range (IQR)3.2%6.0%
Standard Deviation (Sample)4.6%13.5%
Standard Deviation (Population)4.6%13.3%

Correlation Details

Samoan PercentileSample SizeUnemployment Among Women with Children Ages 6 to 17 years
[
0.0%
-
0.5%
]
0.038%
124,085,1738.1%
[
0.0%
-
0.5%
]
0.15%
28,067,4858.0%
[
0.0%
-
0.5%
]
0.26%
9,222,8368.3%
[
0.0%
-
0.5%
]
0.38%
6,681,5548.4%
[
0.0%
-
0.5%
]
0.49%
4,345,3908.9%
[
0.5%
-
1.0%
]
0.60%
2,293,4279.2%
[
0.5%
-
1.0%
]
0.71%
1,589,86910.5%
[
0.5%
-
1.0%
]
0.81%
1,357,2398.1%
[
0.5%
-
1.0%
]
0.94%
867,3389.1%
[
1.0%
-
1.5%
]
1.05%
873,4006.0%
[
1.0%
-
1.5%
]
1.14%
621,4589.4%
[
1.0%
-
1.5%
]
1.27%
450,8136.0%
[
1.0%
-
1.5%
]
1.38%
470,3849.2%
[
1.0%
-
1.5%
]
1.50%
174,48613.4%
[
1.5%
-
2.0%
]
1.58%
321,24110.2%
[
1.5%
-
2.0%
]
1.71%
268,86311.6%
[
1.5%
-
2.0%
]
1.81%
258,8974.6%
[
1.5%
-
2.0%
]
1.93%
111,2468.9%
[
2.0%
-
2.5%
]
2.02%
95,90614.1%
[
2.0%
-
2.5%
]
2.17%
112,92012.0%
[
2.0%
-
2.5%
]
2.26%
392,3698.1%
[
2.0%
-
2.5%
]
2.35%
29,18813.3%
[
2.0%
-
2.5%
]
2.47%
18,7237.6%
[
2.5%
-
3.0%
]
2.61%
361,3507.6%
[
2.5%
-
3.0%
]
2.69%
130,3185.6%
[
2.5%
-
3.0%
]
2.91%
51,0178.6%
[
3.0%
-
3.5%
]
3.05%
6,36837.3%
[
3.0%
-
3.5%
]
3.11%
55,3162.0%
[
3.0%
-
3.5%
]
3.26%
103,7841.9%
[
3.0%
-
3.5%
]
3.44%
51,5434.7%
[
3.5%
-
4.0%
]
3.57%
41,5609.2%
[
3.5%
-
4.0%
]
3.69%
31,7104.9%
[
3.5%
-
4.0%
]
3.80%
13,93224.6%
[
3.5%
-
4.0%
]
3.90%
12,88514.2%
[
4.0%
-
4.5%
]
4.07%
10,88712.2%
[
4.0%
-
4.5%
]
4.13%
72,6058.1%
[
4.0%
-
4.5%
]
4.23%
39,8739.5%
[
4.5%
-
5.0%
]
4.53%
11,0295.4%
[
4.5%
-
5.0%
]
4.99%
4,78658.7%
[
5.0%
-
5.5%
]
5.09%
14,80313.4%
[
5.0%
-
5.5%
]
5.20%
52,3289.7%
[
6.0%
-
6.5%
]
6.04%
72,3241.2%
[
7.5%
-
8.0%
]
7.51%
13,7492.7%
[
7.5%
-
8.0%
]
7.90%
51,3673.3%
[
8.5%
-
9.0%
]
8.74%
10,04212.0%
[
9.0%
-
9.5%
]
9.14%
38,1429.6%
[
13.0%
-
13.5%
]
13.21%
12,3703.7%
[
17.5%
-
18.0%
]
17.60%
2,97120.0%
[
19.5%
-
20.0%
]
19.60%
1,94960.6%
[
20.0%
-
20.5%
]
20.14%
1,89760.6%