Samoan College, 1 year or more
COMPARE
Samoan
Select to Compare
College, 1 year or more
Samoan College, 1 year or more
56.2%
COLLEGE, 1 YEAR OR MORE
1.6/ 100
METRIC RATING
237th/ 347
METRIC RANK
Samoan College, 1 year or more Correlation Chart
The statistical analysis conducted on geographies consisting of 225,205,919 people shows a poor negative correlation between the proportion of Samoans and percentage of population with at least college, 1 year or more education in the United States with a correlation coefficient (R) of -0.105 and weighted average of 56.2%. On average, for every 1% (one percent) increase in Samoans within a typical geography, there is a decrease of 0.19% in percentage of population with at least college, 1 year or more education.
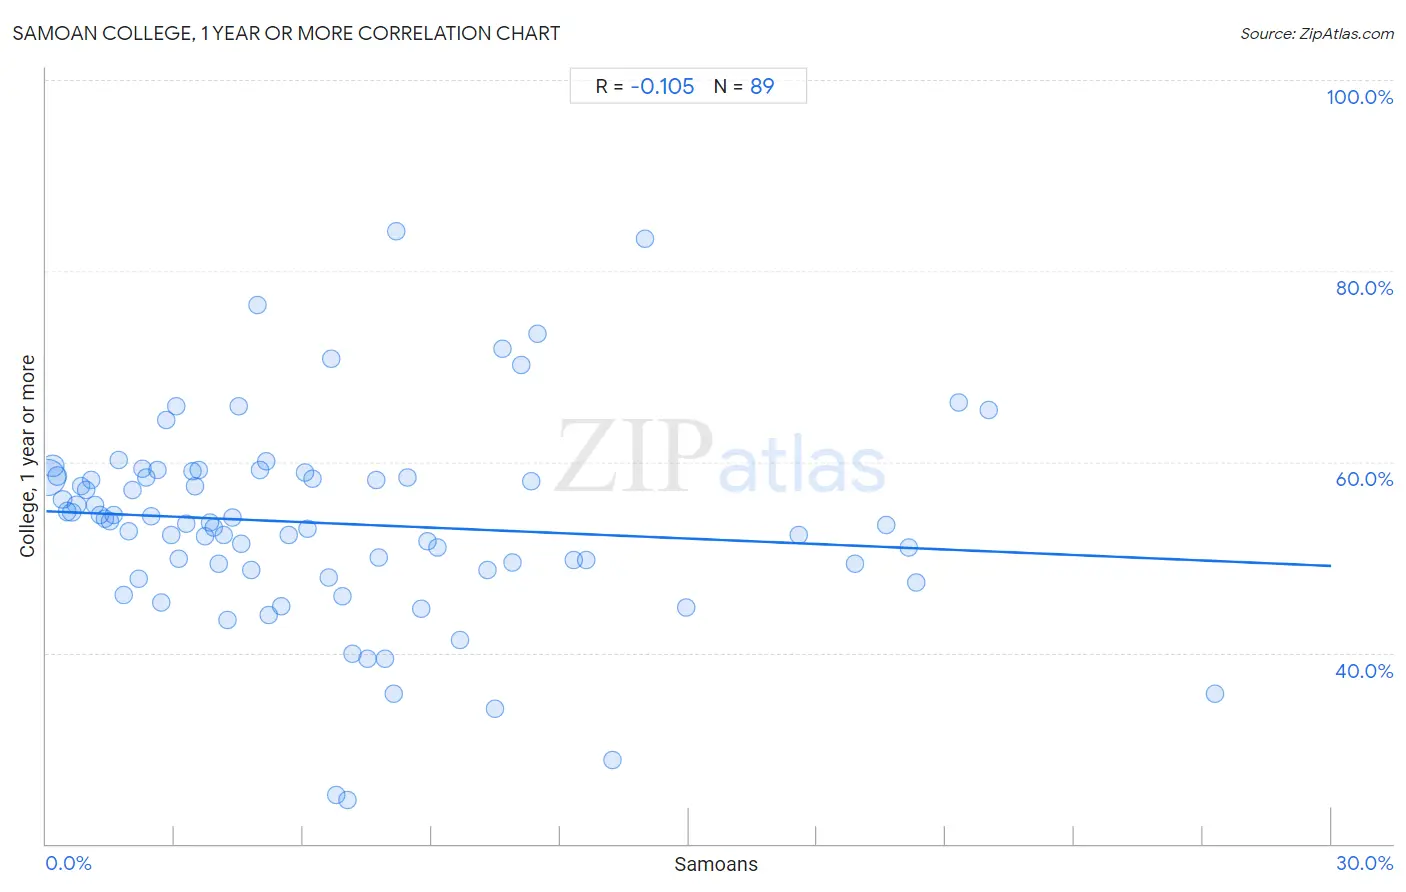
It is essential to understand that the correlation between the percentage of Samoans and percentage of population with at least college, 1 year or more education does not imply a direct cause-and-effect relationship. It remains uncertain whether the presence of Samoans influences an upward or downward trend in the level of percentage of population with at least college, 1 year or more education within an area, or if Samoans simply ended up residing in those areas with higher or lower levels of percentage of population with at least college, 1 year or more education due to other factors.
Demographics Similar to Samoans by College, 1 year or more
In terms of college, 1 year or more, the demographic groups most similar to Samoans are Iroquois (56.2%, a difference of 0.11%), Spanish American (56.3%, a difference of 0.16%), West Indian (56.3%, a difference of 0.16%), Barbadian (56.0%, a difference of 0.27%), and Puget Sound Salish (55.9%, a difference of 0.47%).
| Demographics | Rating | Rank | College, 1 year or more |
| Liberians | 3.1 /100 | #230 | Tragic 56.7% |
| Immigrants from Burma/Myanmar | 2.7 /100 | #231 | Tragic 56.6% |
| Immigrants from Bangladesh | 2.6 /100 | #232 | Tragic 56.6% |
| Nonimmigrants | 2.5 /100 | #233 | Tragic 56.5% |
| Spanish Americans | 1.8 /100 | #234 | Tragic 56.3% |
| West Indians | 1.8 /100 | #235 | Tragic 56.3% |
| Iroquois | 1.7 /100 | #236 | Tragic 56.2% |
| Samoans | 1.6 /100 | #237 | Tragic 56.2% |
| Barbadians | 1.3 /100 | #238 | Tragic 56.0% |
| Puget Sound Salish | 1.1 /100 | #239 | Tragic 55.9% |
| Trinidadians and Tobagonians | 1.1 /100 | #240 | Tragic 55.8% |
| French American Indians | 1.0 /100 | #241 | Tragic 55.8% |
| Marshallese | 1.0 /100 | #242 | Tragic 55.8% |
| Osage | 1.0 /100 | #243 | Tragic 55.8% |
| Chippewa | 0.9 /100 | #244 | Tragic 55.7% |
Samoan College, 1 year or more Correlation Summary
| Measurement | Samoan Data | College, 1 year or more Data |
| Minimum | 0.040% | 24.6% |
| Maximum | 27.3% | 84.1% |
| Range | 27.2% | 59.5% |
| Mean | 6.7% | 53.6% |
| Median | 5.0% | 53.6% |
| Interquartile 25% (IQ1) | 2.4% | 48.7% |
| Interquartile 75% (IQ3) | 9.0% | 58.5% |
| Interquartile Range (IQR) | 6.6% | 9.8% |
| Standard Deviation (Sample) | 5.8% | 10.6% |
| Standard Deviation (Population) | 5.8% | 10.5% |
Correlation Details
| Samoan Percentile | Sample Size | College, 1 year or more |
[ 0.0% - 0.5% ] 0.040% | 145,348,267 | 58.3% |
[ 0.0% - 0.5% ] 0.15% | 35,726,105 | 59.6% |
[ 0.0% - 0.5% ] 0.26% | 12,968,318 | 58.5% |
[ 0.0% - 0.5% ] 0.38% | 8,697,486 | 56.1% |
[ 0.0% - 0.5% ] 0.49% | 5,659,699 | 54.8% |
[ 0.5% - 1.0% ] 0.60% | 3,158,701 | 54.7% |
[ 0.5% - 1.0% ] 0.71% | 2,406,954 | 55.5% |
[ 0.5% - 1.0% ] 0.81% | 2,046,102 | 57.4% |
[ 0.5% - 1.0% ] 0.94% | 1,426,265 | 57.0% |
[ 1.0% - 1.5% ] 1.05% | 1,093,477 | 58.1% |
[ 1.0% - 1.5% ] 1.14% | 857,595 | 55.5% |
[ 1.0% - 1.5% ] 1.27% | 686,158 | 54.4% |
[ 1.0% - 1.5% ] 1.38% | 699,716 | 54.1% |
[ 1.0% - 1.5% ] 1.49% | 272,116 | 53.8% |
[ 1.5% - 2.0% ] 1.58% | 440,934 | 54.5% |
[ 1.5% - 2.0% ] 1.71% | 390,439 | 60.2% |
[ 1.5% - 2.0% ] 1.81% | 314,952 | 46.0% |
[ 1.5% - 2.0% ] 1.93% | 257,599 | 52.7% |
[ 2.0% - 2.5% ] 2.02% | 165,009 | 57.0% |
[ 2.0% - 2.5% ] 2.16% | 205,301 | 47.8% |
[ 2.0% - 2.5% ] 2.26% | 446,400 | 59.3% |
[ 2.0% - 2.5% ] 2.35% | 44,337 | 58.3% |
[ 2.0% - 2.5% ] 2.46% | 78,279 | 54.4% |
[ 2.5% - 3.0% ] 2.61% | 373,158 | 59.2% |
[ 2.5% - 3.0% ] 2.69% | 172,844 | 45.3% |
[ 2.5% - 3.0% ] 2.80% | 25,082 | 64.4% |
[ 2.5% - 3.0% ] 2.91% | 60,518 | 52.3% |
[ 3.0% - 3.5% ] 3.02% | 68,733 | 65.8% |
[ 3.0% - 3.5% ] 3.11% | 56,437 | 49.9% |
[ 3.0% - 3.5% ] 3.26% | 103,784 | 53.5% |
[ 3.0% - 3.5% ] 3.40% | 39,480 | 59.1% |
[ 3.0% - 3.5% ] 3.47% | 119,589 | 57.5% |
[ 3.5% - 4.0% ] 3.56% | 61,891 | 59.2% |
[ 3.5% - 4.0% ] 3.70% | 52,063 | 52.2% |
[ 3.5% - 4.0% ] 3.82% | 41,455 | 53.6% |
[ 3.5% - 4.0% ] 3.90% | 14,251 | 53.1% |
[ 4.0% - 4.5% ] 4.02% | 27,942 | 49.4% |
[ 4.0% - 4.5% ] 4.13% | 74,292 | 52.4% |
[ 4.0% - 4.5% ] 4.23% | 43,061 | 43.5% |
[ 4.0% - 4.5% ] 4.36% | 17,867 | 54.2% |
[ 4.0% - 4.5% ] 4.49% | 5,905 | 65.8% |
[ 4.5% - 5.0% ] 4.55% | 13,705 | 51.4% |
[ 4.5% - 5.0% ] 4.78% | 3,741 | 48.7% |
[ 4.5% - 5.0% ] 4.93% | 365 | 76.5% |
[ 4.5% - 5.0% ] 4.99% | 28,173 | 59.2% |
[ 5.0% - 5.5% ] 5.12% | 36,489 | 60.0% |
[ 5.0% - 5.5% ] 5.21% | 57,907 | 44.0% |
[ 5.0% - 5.5% ] 5.47% | 25,427 | 44.9% |
[ 5.5% - 6.0% ] 5.67% | 8,205 | 52.4% |
[ 6.0% - 6.5% ] 6.04% | 72,324 | 58.8% |
[ 6.0% - 6.5% ] 6.11% | 229 | 52.9% |
[ 6.0% - 6.5% ] 6.21% | 11,373 | 58.3% |
[ 6.5% - 7.0% ] 6.60% | 2,122 | 47.9% |
[ 6.5% - 7.0% ] 6.65% | 7,551 | 70.9% |
[ 6.5% - 7.0% ] 6.76% | 281 | 25.1% |
[ 6.5% - 7.0% ] 6.93% | 101 | 45.9% |
[ 7.0% - 7.5% ] 7.04% | 696 | 24.6% |
[ 7.0% - 7.5% ] 7.14% | 5,743 | 39.9% |
[ 7.5% - 8.0% ] 7.51% | 17,628 | 39.4% |
[ 7.5% - 8.0% ] 7.69% | 182 | 58.2% |
[ 7.5% - 8.0% ] 7.76% | 2,564 | 50.0% |
[ 7.5% - 8.0% ] 7.90% | 51,367 | 39.4% |
[ 8.0% - 8.5% ] 8.11% | 3,909 | 35.7% |
[ 8.0% - 8.5% ] 8.17% | 465 | 84.1% |
[ 8.0% - 8.5% ] 8.44% | 237 | 58.4% |
[ 8.5% - 9.0% ] 8.74% | 10,042 | 44.6% |
[ 8.5% - 9.0% ] 8.91% | 3,188 | 51.7% |
[ 9.0% - 9.5% ] 9.14% | 38,142 | 51.1% |
[ 9.5% - 10.0% ] 9.67% | 331 | 41.3% |
[ 10.0% - 10.5% ] 10.30% | 4,555 | 48.6% |
[ 10.0% - 10.5% ] 10.48% | 620 | 34.1% |
[ 10.5% - 11.0% ] 10.66% | 6,606 | 71.9% |
[ 10.5% - 11.0% ] 10.88% | 377 | 49.4% |
[ 11.0% - 11.5% ] 11.09% | 649 | 70.2% |
[ 11.0% - 11.5% ] 11.33% | 256 | 58.0% |
[ 11.0% - 11.5% ] 11.46% | 759 | 73.4% |
[ 12.0% - 12.5% ] 12.30% | 382 | 49.7% |
[ 12.5% - 13.0% ] 12.61% | 3,593 | 49.7% |
[ 13.0% - 13.5% ] 13.21% | 12,370 | 28.7% |
[ 13.5% - 14.0% ] 13.99% | 143 | 83.3% |
[ 14.5% - 15.0% ] 14.96% | 341 | 44.7% |
[ 17.5% - 18.0% ] 17.56% | 5,713 | 52.3% |
[ 18.5% - 19.0% ] 18.88% | 1,070 | 49.3% |
[ 19.5% - 20.0% ] 19.60% | 1,949 | 53.4% |
[ 20.0% - 20.5% ] 20.14% | 1,897 | 51.0% |
[ 20.0% - 20.5% ] 20.32% | 2,274 | 47.4% |
[ 21.0% - 21.5% ] 21.30% | 5,774 | 66.3% |
[ 22.0% - 22.5% ] 22.01% | 5,411 | 65.5% |
[ 27.0% - 27.5% ] 27.27% | 132 | 35.7% |