Immigrants from Israel Wage/Income Gap

COMPARE

Immigrants from Israel
Race
Ancestry
AfghanAfricanAlaska NativeAlaskan AthabascanAlbanianAleutAlsatianAmericanApacheArabArapahoArgentineanArmenianAssyrian/Chaldean/SyriacAustralianAustrianBahamianBangladeshiBarbadianBasqueBelgianBelizeanBermudanBhutaneseBlackfeetBolivianBrazilianBritishBritish West IndianBulgarianBurmeseCajunCambodianCanadianCape VerdeanCarpatho RusynCelticCentral AmericanCentral American IndianCherokeeCheyenneChickasawChileanChineseChippewaChoctawColombianColvilleComancheCosta RicanCreeCreekCroatianCrowCubanCypriotCzechCzechoslovakianDanishDelawareDominicanDutchDutch West IndianEastern EuropeanEcuadorianEgyptianEnglishEstonianEthiopianEuropeanFijianFilipinoFinnishFrenchFrench American IndianFrench CanadianGermanGerman RussianGhanaianGreekGuamanian/ChamorroGuatemalanGuyaneseHaitianHmongHonduranHopiHoumaHungarianIcelanderIndian (Asian)IndonesianInupiatIranianIraqiIrishIroquoisIsraeliItalianJamaicanJapaneseJordanianKenyanKiowaKoreanLaotianLatvianLebaneseLiberianLithuanianLumbeeLuxembourgerMacedonianMalaysianMalteseMarshalleseMenomineeMexicanMexican American IndianMongolianMoroccanNative HawaiianNavajoNepaleseNew ZealanderNicaraguanNigerianNorthern EuropeanNorwegianOkinawanOsageOttawaPaiutePakistaniPalestinianPanamanianParaguayanPennsylvania GermanPeruvianPimaPolishPortuguesePotawatomiPuebloPuerto RicanPuget Sound SalishRomanianRussianSalvadoranSamoanScandinavianScotch-IrishScottishSeminoleSenegaleseSerbianShoshoneSierra LeoneanSiouxSlavicSlovakSloveneSomaliSouth AfricanSouth AmericanSouth American IndianSoviet UnionSpaniardSpanishSpanish AmericanSpanish American IndianSri LankanSubsaharan AfricanSudaneseSwedishSwissSyrianTaiwaneseThaiTlingit-HaidaTohono O'OdhamTonganTrinidadian and TobagonianTsimshianTurkishU.S. Virgin IslanderUgandanUkrainianUruguayanUteVenezuelanVietnameseWelshWest IndianYakamaYaquiYugoslavianYumanYup'ikZimbabwean
Immigration
NonimmigrantsImmigrantsAfghanistanAfricaAlbaniaArgentinaArmeniaAsiaAustraliaAustriaBahamasBangladeshBarbadosBelarusBelgiumBelizeBoliviaBosnia and HerzegovinaBrazilBulgariaBurma/MyanmarCabo VerdeCambodiaCameroonCanadaCaribbeanCentral AmericaChileChinaColombiaCongoCosta RicaCroatiaCubaCzechoslovakiaDenmarkDominicaDominican RepublicEastern AfricaEastern AsiaEastern EuropeEcuadorEgyptEl SalvadorEnglandEritreaEthiopiaEuropeFijiFranceGermanyGhanaGreeceGrenadaGuatemalaGuyanaHaitiHondurasHong KongHungaryIndiaIndonesiaIranIraqIrelandIsraelItalyJamaicaJapanJordanKazakhstanKenyaKoreaKuwaitLaosLatin AmericaLatviaLebanonLiberiaLithuaniaMalaysiaMexicoMicronesiaMiddle AfricaMoldovaMoroccoNepalNetherlandsNicaraguaNigeriaNorth AmericaNorth MacedoniaNorthern AfricaNorthern EuropeNorwayOceaniaPakistanPanamaPeruPhilippinesPolandPortugalRomaniaRussiaSaudi ArabiaScotlandSenegalSerbiaSierra LeoneSingaporeSomaliaSouth AfricaSouth AmericaSouth Central AsiaSouth Eastern AsiaSouthern EuropeSpainSri LankaSt. Vincent and the GrenadinesSudanSwedenSwitzerlandSyriaTaiwanThailandTrinidad and TobagoTurkeyUgandaUkraineUruguayUzbekistanVenezuelaVietnamWest IndiesWestern AfricaWestern AsiaWestern EuropeYemenZaireZimbabweAzores
Select to Compare
Race
Ancestry
AfghanAfricanAlaska NativeAlaskan AthabascanAlbanianAleutAlsatianAmericanApacheArabArapahoArgentineanArmenianAssyrian/Chaldean/SyriacAustralianAustrianBahamianBangladeshiBarbadianBasqueBelgianBelizeanBermudanBhutaneseBlackfeetBolivianBrazilianBritishBritish West IndianBulgarianBurmeseCajunCambodianCanadianCape VerdeanCarpatho RusynCelticCentral AmericanCentral American IndianCherokeeCheyenneChickasawChileanChineseChippewaChoctawColombianColvilleComancheCosta RicanCreeCreekCroatianCrowCubanCypriotCzechCzechoslovakianDanishDelawareDominicanDutchDutch West IndianEastern EuropeanEcuadorianEgyptianEnglishEstonianEthiopianEuropeanFijianFilipinoFinnishFrenchFrench American IndianFrench CanadianGermanGerman RussianGhanaianGreekGuamanian/ChamorroGuatemalanGuyaneseHaitianHmongHonduranHopiHoumaHungarianIcelanderIndian (Asian)IndonesianInupiatIranianIraqiIrishIroquoisIsraeliItalianJamaicanJapaneseJordanianKenyanKiowaKoreanLaotianLatvianLebaneseLiberianLithuanianLumbeeLuxembourgerMacedonianMalaysianMalteseMarshalleseMenomineeMexicanMexican American IndianMongolianMoroccanNative HawaiianNavajoNepaleseNew ZealanderNicaraguanNigerianNorthern EuropeanNorwegianOkinawanOsageOttawaPaiutePakistaniPalestinianPanamanianParaguayanPennsylvania GermanPeruvianPimaPolishPortuguesePotawatomiPuebloPuerto RicanPuget Sound SalishRomanianRussianSalvadoranSamoanScandinavianScotch-IrishScottishSeminoleSenegaleseSerbianShoshoneSierra LeoneanSiouxSlavicSlovakSloveneSomaliSouth AfricanSouth AmericanSouth American IndianSoviet UnionSpaniardSpanishSpanish AmericanSpanish American IndianSri LankanSubsaharan AfricanSudaneseSwedishSwissSyrianTaiwaneseThaiTlingit-HaidaTohono O'OdhamTonganTrinidadian and TobagonianTsimshianTurkishU.S. Virgin IslanderUgandanUkrainianUruguayanUteVenezuelanVietnameseWelshWest IndianYakamaYaquiYugoslavianYumanYup'ikZimbabwean
Immigration
NonimmigrantsImmigrantsAfghanistanAfricaAlbaniaArgentinaArmeniaAsiaAustraliaAustriaBahamasBangladeshBarbadosBelarusBelgiumBelizeBoliviaBosnia and HerzegovinaBrazilBulgariaBurma/MyanmarCabo VerdeCambodiaCameroonCanadaCaribbeanCentral AmericaChileChinaColombiaCongoCosta RicaCroatiaCubaCzechoslovakiaDenmarkDominicaDominican RepublicEastern AfricaEastern AsiaEastern EuropeEcuadorEgyptEl SalvadorEnglandEritreaEthiopiaEuropeFijiFranceGermanyGhanaGreeceGrenadaGuatemalaGuyanaHaitiHondurasHong KongHungaryIndiaIndonesiaIranIraqIrelandItalyJamaicaJapanJordanKazakhstanKenyaKoreaKuwaitLaosLatin AmericaLatviaLebanonLiberiaLithuaniaMalaysiaMexicoMicronesiaMiddle AfricaMoldovaMoroccoNepalNetherlandsNicaraguaNigeriaNorth AmericaNorth MacedoniaNorthern AfricaNorthern EuropeNorwayOceaniaPakistanPanamaPeruPhilippinesPolandPortugalRomaniaRussiaSaudi ArabiaScotlandSenegalSerbiaSierra LeoneSingaporeSomaliaSouth AfricaSouth AmericaSouth Central AsiaSouth Eastern AsiaSouthern EuropeSpainSri LankaSt. Vincent and the GrenadinesSudanSwedenSwitzerlandSyriaTaiwanThailandTrinidad and TobagoTurkeyUgandaUkraineUruguayUzbekistanVenezuelaVietnamWest IndiesWestern AfricaWestern AsiaWestern EuropeYemenZaireZimbabweAzores
Wage/Income Gap
Income
Poverty
Unemployment
Labor Participation
Family Structure
Vehicle Availability
Education Level
Disability

Immigrants from Israel Wage/Income Gap
Tragic

28.2%
WAGE/INCOME GAP
0.3/ 100
METRIC RATING
293rd/ 347
METRIC RANK

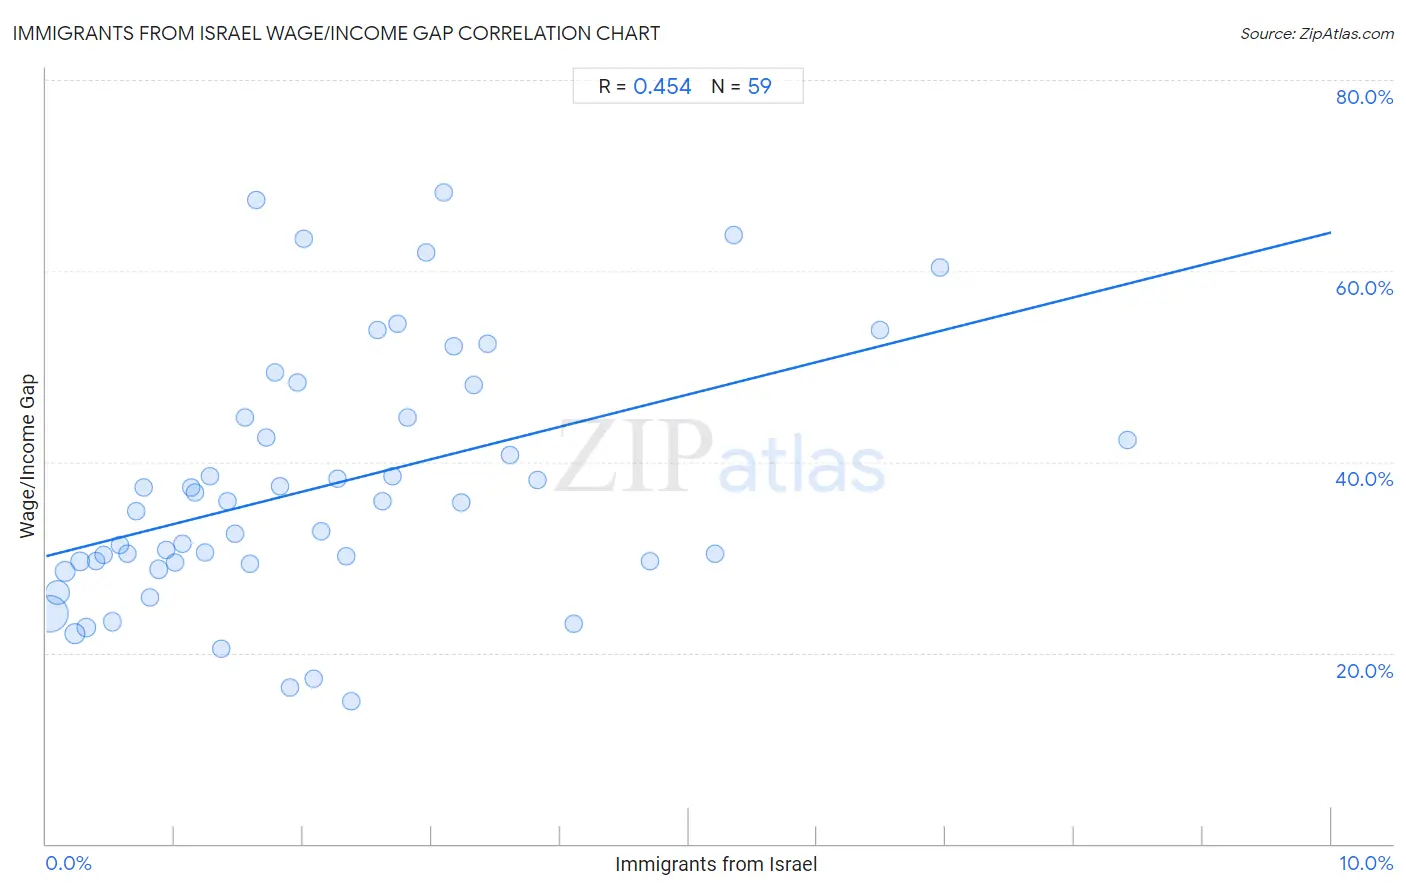
Immigrants from Israel Wage/Income Gap Correlation Chart

The statistical analysis conducted on geographies consisting of 209,965,459 people shows a moderate positive correlation between the proportion of Immigrants from Israel and wage/income gap percentage in the United States with a correlation coefficient (R) of 0.454 and weighted average of 28.2%. On average, for every 1% (one percent) increase in Immigrants from Israel within a typical geography, there is an increase of 3.4% in wage/income gap percentage.
Immigrants from Israel Wage/Income Gap
It is essential to understand that the correlation between the percentage of Immigrants from Israel and wage/income gap percentage does not imply a direct cause-and-effect relationship. It remains uncertain whether the presence of Immigrants from Israel influences an upward or downward trend in the level of wage/income gap percentage within an area, or if Immigrants from Israel simply ended up residing in those areas with higher or lower levels of wage/income gap percentage due to other factors.

Demographics Similar to Immigrants from Israel by Wage/Income Gap

In terms of wage/income gap, the demographic groups most similar to Immigrants from Israel are Greek (28.2%, a difference of 0.020%), Immigrants from Australia (28.2%, a difference of 0.11%), Slovene (28.3%, a difference of 0.15%), Czechoslovakian (28.2%, a difference of 0.16%), and Northern European (28.3%, a difference of 0.16%).
DemographicsRating | RankWage/Income Gap
Immigrants from Austria
0.4
/100
|
#286
Tragic
28.1%
Okinawans
0.4
/100
|
#287
Tragic
28.1%
Choctaw
0.4
/100
|
#288
Tragic
28.1%
Canadians
0.3
/100
|
#289
Tragic
28.1%
Australians
0.3
/100
|
#290
Tragic
28.2%
Czechoslovakians
0.3
/100
|
#291
Tragic
28.2%
Immigrants from Australia
0.3
/100
|
#292
Tragic
28.2%
Immigrants from Israel
0.3
/100
|
#293
Tragic
28.2%
Greeks
0.3
/100
|
#294
Tragic
28.2%
Slovenes
0.3
/100
|
#295
Tragic
28.3%
Northern Europeans
0.3
/100
|
#296
Tragic
28.3%
Immigrants from North America
0.2
/100
|
#297
Tragic
28.4%
Austrians
0.2
/100
|
#298
Tragic
28.4%
Immigrants from North Macedonia
0.2
/100
|
#299
Tragic
28.4%
Immigrants from Northern Europe
0.2
/100
|
#300
Tragic
28.5%

Immigrants from Israel Wage/Income Gap Correlation Summary

MeasurementImmigrants from Israel DataWage/Income Gap Data
Minimum0.027%15.0%
Maximum8.4%68.2%
Range8.4%53.2%
Mean2.2%37.4%
Median1.8%35.8%
Interquartile 25% (IQ1)0.87%29.5%
Interquartile 75% (IQ3)3.0%44.7%
Interquartile Range (IQR)2.1%15.2%
Standard Deviation (Sample)1.8%13.1%
Standard Deviation (Population)1.7%13.0%

Correlation Details

Immigrants from Israel PercentileSample SizeWage/Income Gap
[
0.0%
-
0.5%
]
0.027%
115,562,53624.1%
[
0.0%
-
0.5%
]
0.087%
38,220,88426.3%
[
0.0%
-
0.5%
]
0.15%
13,699,23028.6%
[
0.0%
-
0.5%
]
0.22%
16,554,03422.0%
[
0.0%
-
0.5%
]
0.27%
6,127,35729.6%
[
0.0%
-
0.5%
]
0.32%
7,149,00422.7%
[
0.0%
-
0.5%
]
0.39%
2,290,23629.6%
[
0.0%
-
0.5%
]
0.45%
1,619,37730.3%
[
0.5%
-
1.0%
]
0.51%
1,372,67423.2%
[
0.5%
-
1.0%
]
0.57%
821,81031.3%
[
0.5%
-
1.0%
]
0.63%
969,19030.4%
[
0.5%
-
1.0%
]
0.70%
601,05734.8%
[
0.5%
-
1.0%
]
0.76%
645,27037.3%
[
0.5%
-
1.0%
]
0.81%
481,29625.8%
[
0.5%
-
1.0%
]
0.87%
627,77228.7%
[
0.5%
-
1.0%
]
0.94%
651,95130.8%
[
0.5%
-
1.0%
]
1.00%
218,85129.5%
[
1.0%
-
1.5%
]
1.06%
260,24431.4%
[
1.0%
-
1.5%
]
1.13%
342,19537.3%
[
1.0%
-
1.5%
]
1.15%
186,63236.8%
[
1.0%
-
1.5%
]
1.24%
112,62430.6%
[
1.0%
-
1.5%
]
1.28%
149,84238.5%
[
1.0%
-
1.5%
]
1.36%
87,26320.4%
[
1.0%
-
1.5%
]
1.41%
99,22235.8%
[
1.0%
-
1.5%
]
1.47%
40,86132.5%
[
1.5%
-
2.0%
]
1.55%
85,65944.7%
[
1.5%
-
2.0%
]
1.59%
110,80829.3%
[
1.5%
-
2.0%
]
1.63%
1,35067.5%
[
1.5%
-
2.0%
]
1.71%
49,60442.6%
[
1.5%
-
2.0%
]
1.78%
120,73349.4%
[
1.5%
-
2.0%
]
1.81%
81,90037.5%
[
1.5%
-
2.0%
]
1.89%
7,45016.3%
[
1.5%
-
2.0%
]
1.95%
57,64248.3%
[
2.0%
-
2.5%
]
2.01%
1,44563.4%
[
2.0%
-
2.5%
]
2.08%
6,24417.3%
[
2.0%
-
2.5%
]
2.14%
57,84732.8%
[
2.0%
-
2.5%
]
2.27%
56,39138.2%
[
2.0%
-
2.5%
]
2.34%
12,75630.1%
[
2.0%
-
2.5%
]
2.37%
20,18015.0%
[
2.5%
-
3.0%
]
2.58%
16,19053.8%
[
2.5%
-
3.0%
]
2.62%
62,69835.9%
[
2.5%
-
3.0%
]
2.69%
74,33238.5%
[
2.5%
-
3.0%
]
2.73%
1,13654.4%
[
2.5%
-
3.0%
]
2.81%
39,62144.7%
[
2.5%
-
3.0%
]
2.96%
3,81861.9%
[
3.0%
-
3.5%
]
3.09%
6,76468.2%
[
3.0%
-
3.5%
]
3.17%
42,15552.2%
[
3.0%
-
3.5%
]
3.23%
30,59835.8%
[
3.0%
-
3.5%
]
3.33%
32,88148.0%
[
3.0%
-
3.5%
]
3.43%
96252.4%
[
3.5%
-
4.0%
]
3.61%
4,26340.7%
[
3.5%
-
4.0%
]
3.82%
2,75038.1%
[
4.0%
-
4.5%
]
4.10%
20,41123.1%
[
4.5%
-
5.0%
]
4.70%
31,51729.5%
[
5.0%
-
5.5%
]
5.20%
3,44030.3%
[
5.0%
-
5.5%
]
5.35%
1,06663.7%
[
6.0%
-
6.5%
]
6.49%
18,21053.8%
[
6.5%
-
7.0%
]
6.96%
9,86060.4%
[
8.0%
-
8.5%
]
8.42%
1,36642.3%