Immigrants from Israel Married-couple Households
COMPARE
Immigrants from Israel
Select to Compare
Married-couple Households
Immigrants from Israel Married-couple Households
48.0%
MARRIED-COUPLE HOUSEHOLDS
97.4/ 100
METRIC RATING
85th/ 347
METRIC RANK
Immigrants from Israel Married-couple Households Correlation Chart
The statistical analysis conducted on geographies consisting of 209,978,634 people shows a mild positive correlation between the proportion of Immigrants from Israel and percentage of married-couple family households in the United States with a correlation coefficient (R) of 0.303 and weighted average of 48.0%. On average, for every 1% (one percent) increase in Immigrants from Israel within a typical geography, there is an increase of 1.6% in percentage of married-couple family households.
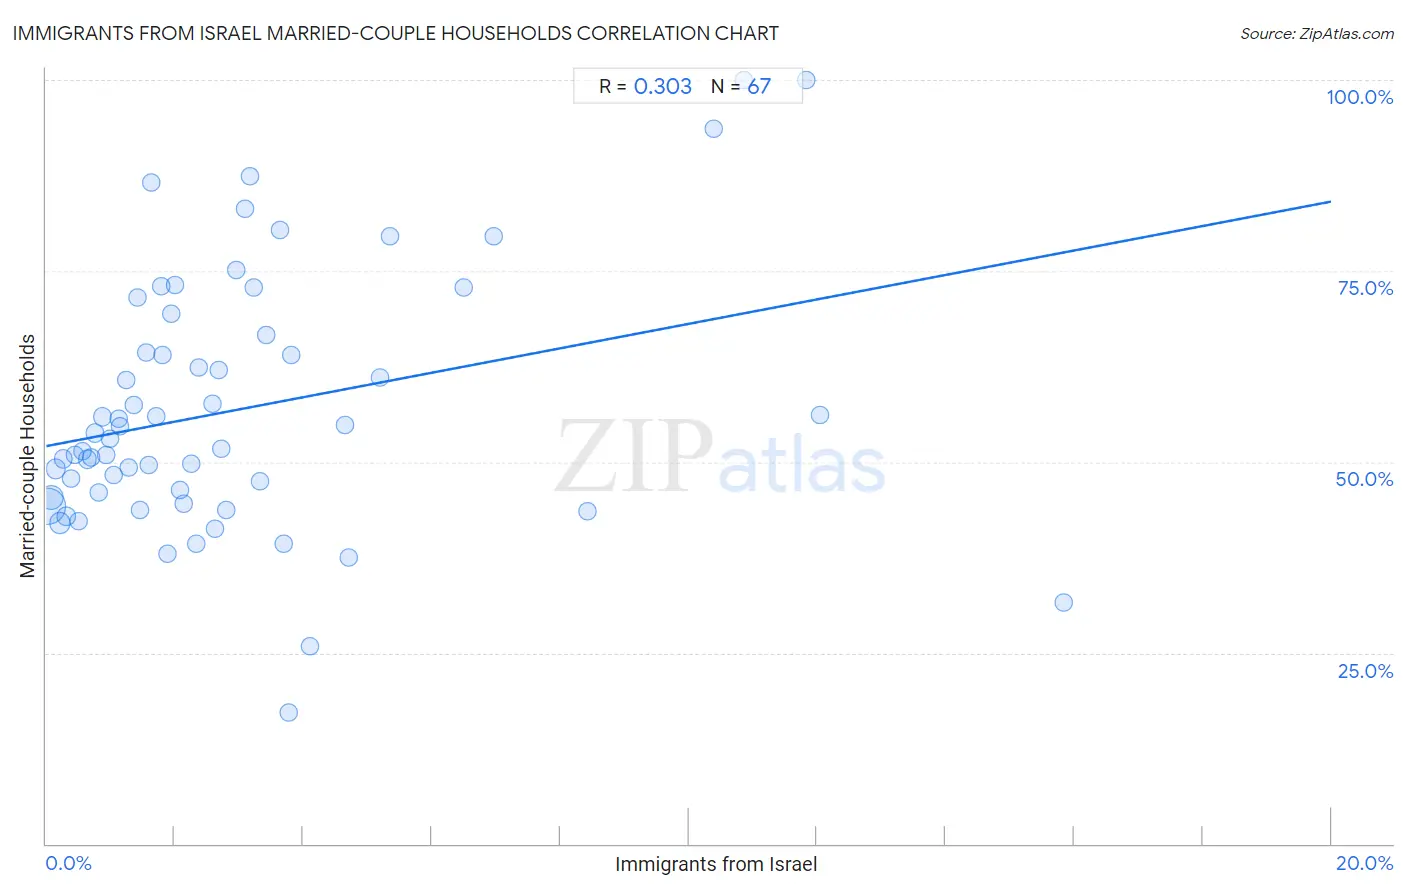
It is essential to understand that the correlation between the percentage of Immigrants from Israel and percentage of married-couple family households does not imply a direct cause-and-effect relationship. It remains uncertain whether the presence of Immigrants from Israel influences an upward or downward trend in the level of percentage of married-couple family households within an area, or if Immigrants from Israel simply ended up residing in those areas with higher or lower levels of percentage of married-couple family households due to other factors.
Demographics Similar to Immigrants from Israel by Married-couple Households
In terms of married-couple households, the demographic groups most similar to Immigrants from Israel are Belgian (48.0%, a difference of 0.030%), Immigrants from Ireland (48.0%, a difference of 0.040%), Afghan (48.0%, a difference of 0.040%), Ukrainian (48.1%, a difference of 0.050%), and Guamanian/Chamorro (48.1%, a difference of 0.070%).
| Demographics | Rating | Rank | Married-couple Households |
| Egyptians | 98.2 /100 | #78 | Exceptional 48.2% |
| Immigrants from Netherlands | 98.2 /100 | #79 | Exceptional 48.2% |
| Russians | 98.1 /100 | #80 | Exceptional 48.2% |
| Finns | 98.0 /100 | #81 | Exceptional 48.1% |
| Immigrants from Poland | 97.7 /100 | #82 | Exceptional 48.1% |
| Guamanians/Chamorros | 97.6 /100 | #83 | Exceptional 48.1% |
| Ukrainians | 97.6 /100 | #84 | Exceptional 48.1% |
| Immigrants from Israel | 97.4 /100 | #85 | Exceptional 48.0% |
| Belgians | 97.4 /100 | #86 | Exceptional 48.0% |
| Immigrants from Ireland | 97.3 /100 | #87 | Exceptional 48.0% |
| Afghans | 97.3 /100 | #88 | Exceptional 48.0% |
| Cypriots | 97.2 /100 | #89 | Exceptional 48.0% |
| French | 97.2 /100 | #90 | Exceptional 48.0% |
| Immigrants from Moldova | 97.0 /100 | #91 | Exceptional 48.0% |
| Palestinians | 96.9 /100 | #92 | Exceptional 48.0% |
Immigrants from Israel Married-couple Households Correlation Summary
| Measurement | Immigrants from Israel Data | Married-couple Households Data |
| Minimum | 0.027% | 17.2% |
| Maximum | 15.8% | 100.0% |
| Range | 15.8% | 82.8% |
| Mean | 3.0% | 56.9% |
| Median | 2.0% | 53.0% |
| Interquartile 25% (IQ1) | 1.00% | 45.4% |
| Interquartile 75% (IQ3) | 3.6% | 66.7% |
| Interquartile Range (IQR) | 2.6% | 21.3% |
| Standard Deviation (Sample) | 3.2% | 16.8% |
| Standard Deviation (Population) | 3.2% | 16.7% |
Correlation Details
| Immigrants from Israel Percentile | Sample Size | Married-couple Households |
[ 0.0% - 0.5% ] 0.027% | 115,562,536 | 44.2% |
[ 0.0% - 0.5% ] 0.087% | 38,220,884 | 45.4% |
[ 0.0% - 0.5% ] 0.15% | 13,703,659 | 49.1% |
[ 0.0% - 0.5% ] 0.22% | 16,526,886 | 42.0% |
[ 0.0% - 0.5% ] 0.27% | 6,129,412 | 50.3% |
[ 0.0% - 0.5% ] 0.32% | 7,161,453 | 42.9% |
[ 0.0% - 0.5% ] 0.39% | 2,284,478 | 47.8% |
[ 0.0% - 0.5% ] 0.45% | 1,617,333 | 50.9% |
[ 0.5% - 1.0% ] 0.51% | 1,378,845 | 42.2% |
[ 0.5% - 1.0% ] 0.57% | 823,330 | 51.4% |
[ 0.5% - 1.0% ] 0.63% | 967,050 | 50.3% |
[ 0.5% - 1.0% ] 0.70% | 601,595 | 50.5% |
[ 0.5% - 1.0% ] 0.76% | 645,270 | 53.8% |
[ 0.5% - 1.0% ] 0.81% | 482,286 | 46.0% |
[ 0.5% - 1.0% ] 0.87% | 631,732 | 55.9% |
[ 0.5% - 1.0% ] 0.94% | 652,056 | 50.9% |
[ 0.5% - 1.0% ] 1.00% | 218,851 | 53.0% |
[ 1.0% - 1.5% ] 1.06% | 260,244 | 48.3% |
[ 1.0% - 1.5% ] 1.12% | 348,001 | 55.6% |
[ 1.0% - 1.5% ] 1.15% | 186,632 | 54.6% |
[ 1.0% - 1.5% ] 1.24% | 112,624 | 60.7% |
[ 1.0% - 1.5% ] 1.28% | 149,842 | 49.2% |
[ 1.0% - 1.5% ] 1.36% | 88,001 | 57.4% |
[ 1.0% - 1.5% ] 1.41% | 100,014 | 71.6% |
[ 1.0% - 1.5% ] 1.47% | 40,861 | 43.7% |
[ 1.5% - 2.0% ] 1.55% | 87,458 | 64.3% |
[ 1.5% - 2.0% ] 1.59% | 113,181 | 49.7% |
[ 1.5% - 2.0% ] 1.63% | 1,350 | 86.6% |
[ 1.5% - 2.0% ] 1.71% | 49,604 | 55.9% |
[ 1.5% - 2.0% ] 1.78% | 121,872 | 73.0% |
[ 1.5% - 2.0% ] 1.81% | 81,900 | 63.9% |
[ 1.5% - 2.0% ] 1.89% | 8,141 | 37.9% |
[ 1.5% - 2.0% ] 1.95% | 59,070 | 69.4% |
[ 2.0% - 2.5% ] 2.01% | 1,445 | 73.1% |
[ 2.0% - 2.5% ] 2.08% | 6,244 | 46.2% |
[ 2.0% - 2.5% ] 2.14% | 57,847 | 44.5% |
[ 2.0% - 2.5% ] 2.27% | 56,391 | 49.7% |
[ 2.0% - 2.5% ] 2.34% | 13,401 | 39.2% |
[ 2.0% - 2.5% ] 2.37% | 20,180 | 62.3% |
[ 2.5% - 3.0% ] 2.58% | 16,190 | 57.6% |
[ 2.5% - 3.0% ] 2.62% | 62,698 | 41.2% |
[ 2.5% - 3.0% ] 2.69% | 74,332 | 62.0% |
[ 2.5% - 3.0% ] 2.73% | 1,136 | 51.6% |
[ 2.5% - 3.0% ] 2.81% | 39,621 | 43.7% |
[ 2.5% - 3.0% ] 2.96% | 5,070 | 75.2% |
[ 3.0% - 3.5% ] 3.09% | 6,764 | 83.1% |
[ 3.0% - 3.5% ] 3.17% | 42,155 | 87.5% |
[ 3.0% - 3.5% ] 3.23% | 31,910 | 72.8% |
[ 3.0% - 3.5% ] 3.33% | 32,881 | 47.5% |
[ 3.0% - 3.5% ] 3.43% | 962 | 66.7% |
[ 3.5% - 4.0% ] 3.65% | 1,207 | 80.4% |
[ 3.5% - 4.0% ] 3.70% | 54 | 39.3% |
[ 3.5% - 4.0% ] 3.77% | 106 | 17.2% |
[ 3.5% - 4.0% ] 3.82% | 2,750 | 64.0% |
[ 4.0% - 4.5% ] 4.10% | 20,411 | 25.9% |
[ 4.5% - 5.0% ] 4.66% | 1,438 | 54.9% |
[ 4.5% - 5.0% ] 4.70% | 31,517 | 37.5% |
[ 5.0% - 5.5% ] 5.20% | 3,440 | 61.1% |
[ 5.0% - 5.5% ] 5.35% | 1,066 | 79.5% |
[ 6.0% - 6.5% ] 6.49% | 18,210 | 72.8% |
[ 6.5% - 7.0% ] 6.96% | 9,860 | 79.5% |
[ 8.0% - 8.5% ] 8.42% | 1,366 | 43.5% |
[ 10.0% - 10.5% ] 10.39% | 308 | 93.7% |
[ 10.5% - 11.0% ] 10.85% | 295 | 100.0% |
[ 11.5% - 12.0% ] 11.83% | 93 | 100.0% |
[ 12.0% - 12.5% ] 12.03% | 349 | 56.1% |
[ 15.5% - 16.0% ] 15.84% | 486 | 31.6% |