Immigrants from Israel Married-Couple Family Poverty

COMPARE

Immigrants from Israel
Race
Ancestry
AfghanAfricanAlaska NativeAlaskan AthabascanAlbanianAleutAlsatianAmericanApacheArabArapahoArgentineanArmenianAssyrian/Chaldean/SyriacAustralianAustrianBahamianBangladeshiBarbadianBasqueBelgianBelizeanBermudanBhutaneseBlackfeetBolivianBrazilianBritishBritish West IndianBulgarianBurmeseCajunCambodianCanadianCape VerdeanCarpatho RusynCelticCentral AmericanCentral American IndianCherokeeCheyenneChickasawChileanChineseChippewaChoctawColombianColvilleComancheCosta RicanCreeCreekCroatianCrowCubanCypriotCzechCzechoslovakianDanishDelawareDominicanDutchDutch West IndianEastern EuropeanEcuadorianEgyptianEnglishEstonianEthiopianEuropeanFijianFilipinoFinnishFrenchFrench American IndianFrench CanadianGermanGerman RussianGhanaianGreekGuamanian/ChamorroGuatemalanGuyaneseHaitianHmongHonduranHopiHoumaHungarianIcelanderIndian (Asian)IndonesianInupiatIranianIraqiIrishIroquoisIsraeliItalianJamaicanJapaneseJordanianKenyanKiowaKoreanLaotianLatvianLebaneseLiberianLithuanianLumbeeLuxembourgerMacedonianMalaysianMalteseMarshalleseMenomineeMexicanMexican American IndianMongolianMoroccanNative HawaiianNavajoNepaleseNew ZealanderNicaraguanNigerianNorthern EuropeanNorwegianOkinawanOsageOttawaPaiutePakistaniPalestinianPanamanianParaguayanPennsylvania GermanPeruvianPimaPolishPortuguesePotawatomiPuebloPuerto RicanPuget Sound SalishRomanianRussianSalvadoranSamoanScandinavianScotch-IrishScottishSeminoleSenegaleseSerbianShoshoneSierra LeoneanSiouxSlavicSlovakSloveneSomaliSouth AfricanSouth AmericanSouth American IndianSoviet UnionSpaniardSpanishSpanish AmericanSpanish American IndianSri LankanSubsaharan AfricanSudaneseSwedishSwissSyrianTaiwaneseThaiTlingit-HaidaTohono O'OdhamTonganTrinidadian and TobagonianTsimshianTurkishU.S. Virgin IslanderUgandanUkrainianUruguayanUteVenezuelanVietnameseWelshWest IndianYakamaYaquiYugoslavianYumanYup'ikZimbabwean
Immigration
NonimmigrantsImmigrantsAfghanistanAfricaAlbaniaArgentinaArmeniaAsiaAustraliaAustriaBahamasBangladeshBarbadosBelarusBelgiumBelizeBoliviaBosnia and HerzegovinaBrazilBulgariaBurma/MyanmarCabo VerdeCambodiaCameroonCanadaCaribbeanCentral AmericaChileChinaColombiaCongoCosta RicaCroatiaCubaCzechoslovakiaDenmarkDominicaDominican RepublicEastern AfricaEastern AsiaEastern EuropeEcuadorEgyptEl SalvadorEnglandEritreaEthiopiaEuropeFijiFranceGermanyGhanaGreeceGrenadaGuatemalaGuyanaHaitiHondurasHong KongHungaryIndiaIndonesiaIranIraqIrelandIsraelItalyJamaicaJapanJordanKazakhstanKenyaKoreaKuwaitLaosLatin AmericaLatviaLebanonLiberiaLithuaniaMalaysiaMexicoMicronesiaMiddle AfricaMoldovaMoroccoNepalNetherlandsNicaraguaNigeriaNorth AmericaNorth MacedoniaNorthern AfricaNorthern EuropeNorwayOceaniaPakistanPanamaPeruPhilippinesPolandPortugalRomaniaRussiaSaudi ArabiaScotlandSenegalSerbiaSierra LeoneSingaporeSomaliaSouth AfricaSouth AmericaSouth Central AsiaSouth Eastern AsiaSouthern EuropeSpainSri LankaSt. Vincent and the GrenadinesSudanSwedenSwitzerlandSyriaTaiwanThailandTrinidad and TobagoTurkeyUgandaUkraineUruguayUzbekistanVenezuelaVietnamWest IndiesWestern AfricaWestern AsiaWestern EuropeYemenZaireZimbabweAzores
Select to Compare
Race
Ancestry
AfghanAfricanAlaska NativeAlaskan AthabascanAlbanianAleutAlsatianAmericanApacheArabArapahoArgentineanArmenianAssyrian/Chaldean/SyriacAustralianAustrianBahamianBangladeshiBarbadianBasqueBelgianBelizeanBermudanBhutaneseBlackfeetBolivianBrazilianBritishBritish West IndianBulgarianBurmeseCajunCambodianCanadianCape VerdeanCarpatho RusynCelticCentral AmericanCentral American IndianCherokeeCheyenneChickasawChileanChineseChippewaChoctawColombianColvilleComancheCosta RicanCreeCreekCroatianCrowCubanCypriotCzechCzechoslovakianDanishDelawareDominicanDutchDutch West IndianEastern EuropeanEcuadorianEgyptianEnglishEstonianEthiopianEuropeanFijianFilipinoFinnishFrenchFrench American IndianFrench CanadianGermanGerman RussianGhanaianGreekGuamanian/ChamorroGuatemalanGuyaneseHaitianHmongHonduranHopiHoumaHungarianIcelanderIndian (Asian)IndonesianInupiatIranianIraqiIrishIroquoisIsraeliItalianJamaicanJapaneseJordanianKenyanKiowaKoreanLaotianLatvianLebaneseLiberianLithuanianLumbeeLuxembourgerMacedonianMalaysianMalteseMarshalleseMenomineeMexicanMexican American IndianMongolianMoroccanNative HawaiianNavajoNepaleseNew ZealanderNicaraguanNigerianNorthern EuropeanNorwegianOkinawanOsageOttawaPaiutePakistaniPalestinianPanamanianParaguayanPennsylvania GermanPeruvianPimaPolishPortuguesePotawatomiPuebloPuerto RicanPuget Sound SalishRomanianRussianSalvadoranSamoanScandinavianScotch-IrishScottishSeminoleSenegaleseSerbianShoshoneSierra LeoneanSiouxSlavicSlovakSloveneSomaliSouth AfricanSouth AmericanSouth American IndianSoviet UnionSpaniardSpanishSpanish AmericanSpanish American IndianSri LankanSubsaharan AfricanSudaneseSwedishSwissSyrianTaiwaneseThaiTlingit-HaidaTohono O'OdhamTonganTrinidadian and TobagonianTsimshianTurkishU.S. Virgin IslanderUgandanUkrainianUruguayanUteVenezuelanVietnameseWelshWest IndianYakamaYaquiYugoslavianYumanYup'ikZimbabwean
Immigration
NonimmigrantsImmigrantsAfghanistanAfricaAlbaniaArgentinaArmeniaAsiaAustraliaAustriaBahamasBangladeshBarbadosBelarusBelgiumBelizeBoliviaBosnia and HerzegovinaBrazilBulgariaBurma/MyanmarCabo VerdeCambodiaCameroonCanadaCaribbeanCentral AmericaChileChinaColombiaCongoCosta RicaCroatiaCubaCzechoslovakiaDenmarkDominicaDominican RepublicEastern AfricaEastern AsiaEastern EuropeEcuadorEgyptEl SalvadorEnglandEritreaEthiopiaEuropeFijiFranceGermanyGhanaGreeceGrenadaGuatemalaGuyanaHaitiHondurasHong KongHungaryIndiaIndonesiaIranIraqIrelandItalyJamaicaJapanJordanKazakhstanKenyaKoreaKuwaitLaosLatin AmericaLatviaLebanonLiberiaLithuaniaMalaysiaMexicoMicronesiaMiddle AfricaMoldovaMoroccoNepalNetherlandsNicaraguaNigeriaNorth AmericaNorth MacedoniaNorthern AfricaNorthern EuropeNorwayOceaniaPakistanPanamaPeruPhilippinesPolandPortugalRomaniaRussiaSaudi ArabiaScotlandSenegalSerbiaSierra LeoneSingaporeSomaliaSouth AfricaSouth AmericaSouth Central AsiaSouth Eastern AsiaSouthern EuropeSpainSri LankaSt. Vincent and the GrenadinesSudanSwedenSwitzerlandSyriaTaiwanThailandTrinidad and TobagoTurkeyUgandaUkraineUruguayUzbekistanVenezuelaVietnamWest IndiesWestern AfricaWestern AsiaWestern EuropeYemenZaireZimbabweAzores
Married-Couple Family Poverty
Income
Poverty
Unemployment
Labor Participation
Family Structure
Vehicle Availability
Education Level
Disability

Immigrants from Israel Married-Couple Family Poverty
Fair

5.4%
POVERTY | MARRIED-COUPLE FAMILIES
27.8/ 100
METRIC RATING
194th/ 347
METRIC RANK

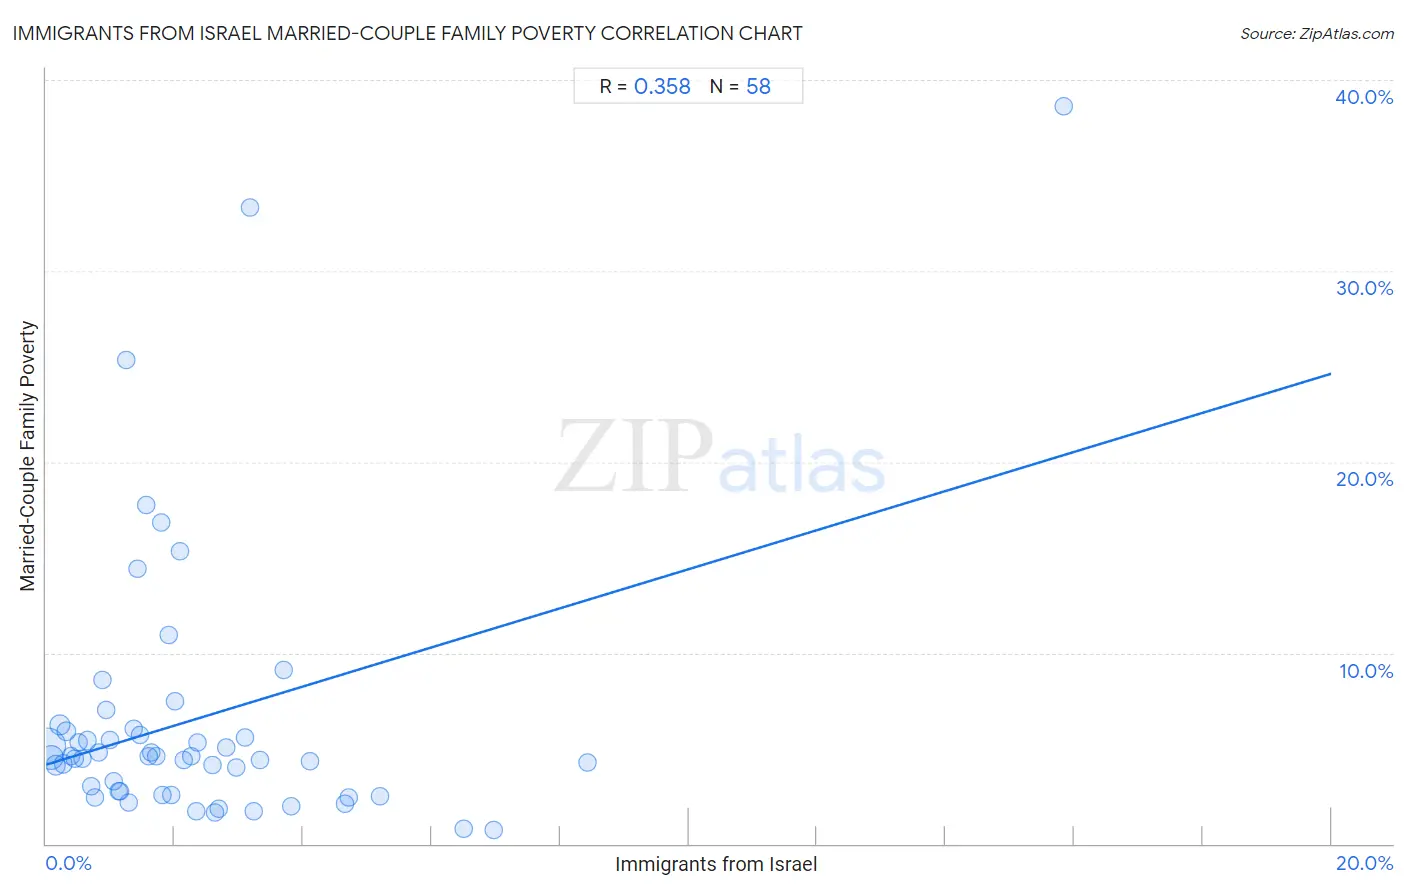
Immigrants from Israel Married-Couple Family Poverty Correlation Chart

The statistical analysis conducted on geographies consisting of 209,060,562 people shows a mild positive correlation between the proportion of Immigrants from Israel and poverty level among married-couple families in the United States with a correlation coefficient (R) of 0.358 and weighted average of 5.4%. On average, for every 1% (one percent) increase in Immigrants from Israel within a typical geography, there is an increase of 1.0% in poverty level among married-couple families.
Immigrants from Israel Married-Couple Family Poverty
It is essential to understand that the correlation between the percentage of Immigrants from Israel and poverty level among married-couple families does not imply a direct cause-and-effect relationship. It remains uncertain whether the presence of Immigrants from Israel influences an upward or downward trend in the level of poverty level among married-couple families within an area, or if Immigrants from Israel simply ended up residing in those areas with higher or lower levels of poverty level among married-couple families due to other factors.

Demographics Similar to Immigrants from Israel by Married-Couple Family Poverty

In terms of married-couple family poverty, the demographic groups most similar to Immigrants from Israel are Immigrants from the Azores (5.4%, a difference of 0.040%), Spaniard (5.4%, a difference of 0.060%), Malaysian (5.4%, a difference of 0.22%), Liberian (5.4%, a difference of 0.22%), and Immigrants from Belarus (5.4%, a difference of 0.24%).
DemographicsRating | RankMarried-Couple Family Poverty
Immigrants from Albania
33.8
/100
|
#187
Fair
5.3%
Israelis
33.1
/100
|
#188
Fair
5.3%
South American Indians
32.5
/100
|
#189
Fair
5.3%
Ugandans
31.6
/100
|
#190
Fair
5.3%
Immigrants from Cabo Verde
30.9
/100
|
#191
Fair
5.3%
Cape Verdeans
30.7
/100
|
#192
Fair
5.3%
Malaysians
29.5
/100
|
#193
Fair
5.4%
Immigrants from Israel
27.8
/100
|
#194
Fair
5.4%
Immigrants from the Azores
27.5
/100
|
#195
Fair
5.4%
Spaniards
27.4
/100
|
#196
Fair
5.4%
Liberians
26.3
/100
|
#197
Fair
5.4%
Immigrants from Belarus
26.2
/100
|
#198
Fair
5.4%
Uruguayans
25.0
/100
|
#199
Fair
5.4%
Immigrants from Morocco
24.3
/100
|
#200
Fair
5.4%
Lebanese
24.1
/100
|
#201
Fair
5.4%

Immigrants from Israel Married-Couple Family Poverty Correlation Summary

MeasurementImmigrants from Israel DataMarried-Couple Family Poverty Data
Minimum0.027%0.74%
Maximum15.8%38.6%
Range15.8%37.9%
Mean2.3%6.5%
Median1.7%4.5%
Interquartile 25% (IQ1)0.87%2.7%
Interquartile 75% (IQ3)3.0%5.9%
Interquartile Range (IQR)2.1%3.2%
Standard Deviation (Sample)2.5%7.2%
Standard Deviation (Population)2.5%7.1%

Correlation Details

Immigrants from Israel PercentileSample SizeMarried-Couple Family Poverty
[
0.0%
-
0.5%
]
0.027%
115,552,8885.1%
[
0.0%
-
0.5%
]
0.087%
38,006,7684.5%
[
0.0%
-
0.5%
]
0.15%
13,564,3544.1%
[
0.0%
-
0.5%
]
0.22%
16,393,3086.2%
[
0.0%
-
0.5%
]
0.27%
6,090,4854.2%
[
0.0%
-
0.5%
]
0.32%
7,127,3625.9%
[
0.0%
-
0.5%
]
0.39%
2,231,1064.6%
[
0.0%
-
0.5%
]
0.45%
1,576,6224.5%
[
0.5%
-
1.0%
]
0.51%
1,349,5155.3%
[
0.5%
-
1.0%
]
0.57%
795,2864.5%
[
0.5%
-
1.0%
]
0.63%
928,8125.4%
[
0.5%
-
1.0%
]
0.70%
572,0773.0%
[
0.5%
-
1.0%
]
0.76%
630,4492.4%
[
0.5%
-
1.0%
]
0.81%
478,4284.8%
[
0.5%
-
1.0%
]
0.87%
624,8948.6%
[
0.5%
-
1.0%
]
0.94%
639,4787.0%
[
1.0%
-
1.5%
]
1.00%
205,2625.4%
[
1.0%
-
1.5%
]
1.06%
260,0503.3%
[
1.0%
-
1.5%
]
1.13%
346,6642.7%
[
1.0%
-
1.5%
]
1.15%
179,7552.8%
[
1.0%
-
1.5%
]
1.24%
112,62425.3%
[
1.0%
-
1.5%
]
1.28%
149,5332.2%
[
1.0%
-
1.5%
]
1.36%
81,6706.0%
[
1.0%
-
1.5%
]
1.41%
98,00314.4%
[
1.0%
-
1.5%
]
1.47%
40,1735.7%
[
1.5%
-
2.0%
]
1.55%
85,09217.8%
[
1.5%
-
2.0%
]
1.59%
112,5004.6%
[
1.5%
-
2.0%
]
1.63%
1,3504.8%
[
1.5%
-
2.0%
]
1.71%
49,6044.6%
[
1.5%
-
2.0%
]
1.78%
118,94416.8%
[
1.5%
-
2.0%
]
1.81%
79,0012.6%
[
1.5%
-
2.0%
]
1.91%
2,51310.9%
[
1.5%
-
2.0%
]
1.95%
53,3062.6%
[
2.0%
-
2.5%
]
2.01%
1,4457.5%
[
2.0%
-
2.5%
]
2.08%
5,51615.3%
[
2.0%
-
2.5%
]
2.14%
56,6724.4%
[
2.0%
-
2.5%
]
2.27%
56,0384.6%
[
2.0%
-
2.5%
]
2.33%
5,3131.7%
[
2.0%
-
2.5%
]
2.35%
4,4235.3%
[
2.5%
-
3.0%
]
2.58%
16,1904.1%
[
2.5%
-
3.0%
]
2.62%
62,6981.6%
[
2.5%
-
3.0%
]
2.69%
67,6021.8%
[
2.5%
-
3.0%
]
2.81%
39,6215.0%
[
2.5%
-
3.0%
]
2.96%
4,4604.0%
[
3.0%
-
3.5%
]
3.09%
6,7645.6%
[
3.0%
-
3.5%
]
3.17%
41,62133.3%
[
3.0%
-
3.5%
]
3.23%
31,9101.7%
[
3.0%
-
3.5%
]
3.33%
32,8814.4%
[
3.5%
-
4.0%
]
3.70%
549.1%
[
3.5%
-
4.0%
]
3.82%
2,7501.9%
[
4.0%
-
4.5%
]
4.10%
20,4114.3%
[
4.5%
-
5.0%
]
4.66%
1,4382.1%
[
4.5%
-
5.0%
]
4.70%
31,5172.5%
[
5.0%
-
5.5%
]
5.20%
3,4402.5%
[
6.0%
-
6.5%
]
6.49%
18,2100.81%
[
6.5%
-
7.0%
]
6.96%
9,8600.74%
[
8.0%
-
8.5%
]
8.42%
1,3664.3%
[
15.5%
-
16.0%
]
15.84%
48638.6%