Immigrants from Iraq Married-Couple Family Poverty
COMPARE
Immigrants from Iraq
Select to Compare
Married-Couple Family Poverty
Immigrants from Iraq Married-Couple Family Poverty
5.7%
POVERTY | MARRIED-COUPLE FAMILIES
4.4/ 100
METRIC RATING
231st/ 347
METRIC RANK
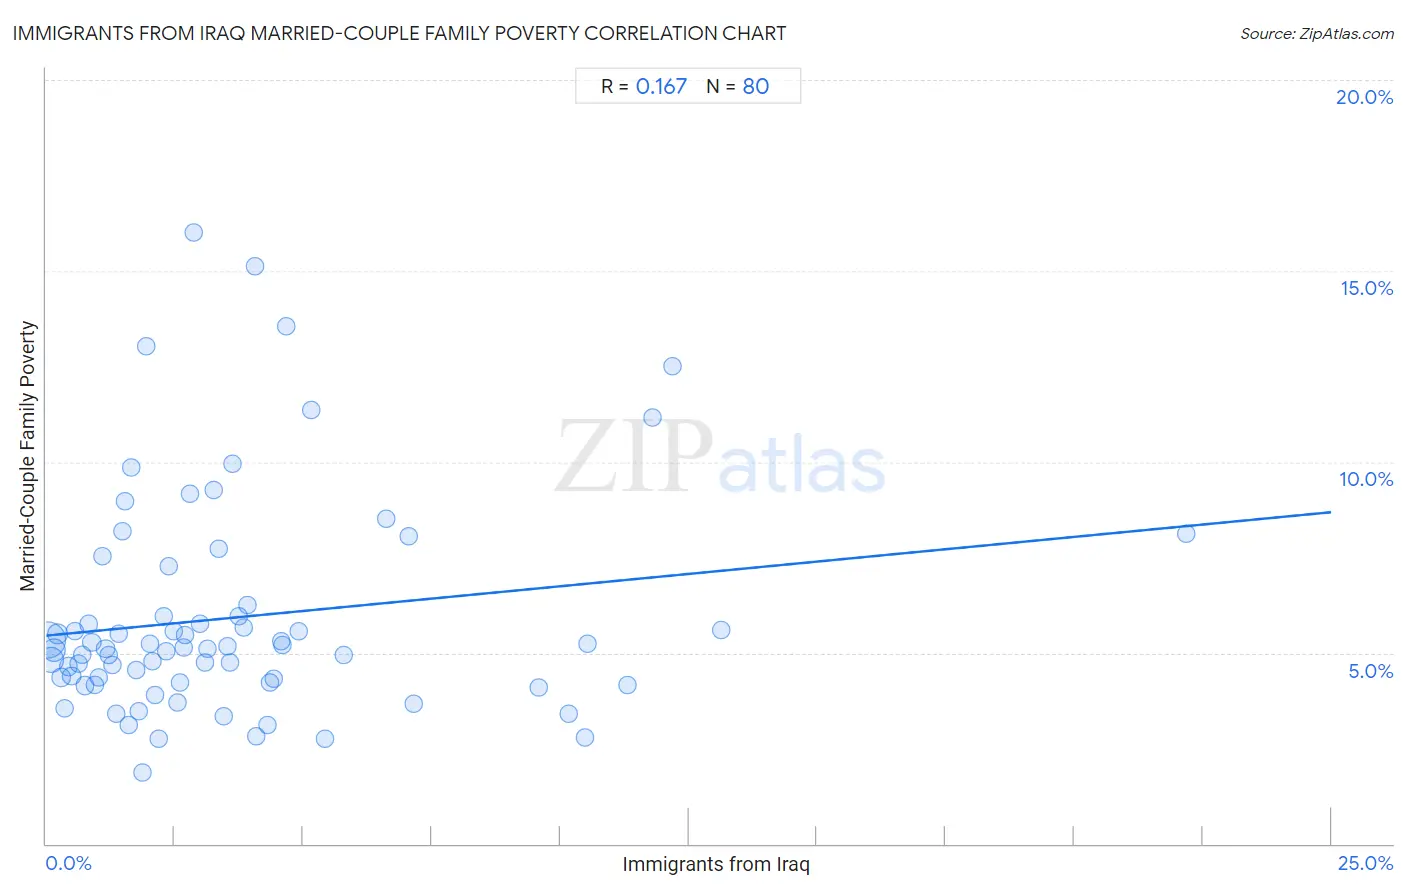
Immigrants from Iraq Married-Couple Family Poverty Correlation Chart
The statistical analysis conducted on geographies consisting of 194,160,466 people shows a poor positive correlation between the proportion of Immigrants from Iraq and poverty level among married-couple families in the United States with a correlation coefficient (R) of 0.167 and weighted average of 5.7%. On average, for every 1% (one percent) increase in Immigrants from Iraq within a typical geography, there is an increase of 0.13% in poverty level among married-couple families.
It is essential to understand that the correlation between the percentage of Immigrants from Iraq and poverty level among married-couple families does not imply a direct cause-and-effect relationship. It remains uncertain whether the presence of Immigrants from Iraq influences an upward or downward trend in the level of poverty level among married-couple families within an area, or if Immigrants from Iraq simply ended up residing in those areas with higher or lower levels of poverty level among married-couple families due to other factors.
Demographics Similar to Immigrants from Iraq by Married-Couple Family Poverty
In terms of married-couple family poverty, the demographic groups most similar to Immigrants from Iraq are Immigrants from Laos (5.7%, a difference of 0.060%), Moroccan (5.7%, a difference of 0.26%), Subsaharan African (5.7%, a difference of 0.29%), Immigrants from Colombia (5.7%, a difference of 0.49%), and Immigrants from Uruguay (5.7%, a difference of 0.50%).
| Demographics | Rating | Rank | Married-Couple Family Poverty |
| Sudanese | 6.4 /100 | #224 | Tragic 5.6% |
| Immigrants from Cambodia | 6.1 /100 | #225 | Tragic 5.6% |
| South Americans | 5.7 /100 | #226 | Tragic 5.6% |
| Immigrants from Zaire | 5.6 /100 | #227 | Tragic 5.6% |
| Arabs | 5.4 /100 | #228 | Tragic 5.7% |
| Sub-Saharan Africans | 4.9 /100 | #229 | Tragic 5.7% |
| Moroccans | 4.9 /100 | #230 | Tragic 5.7% |
| Immigrants from Iraq | 4.4 /100 | #231 | Tragic 5.7% |
| Immigrants from Laos | 4.4 /100 | #232 | Tragic 5.7% |
| Immigrants from Colombia | 3.7 /100 | #233 | Tragic 5.7% |
| Immigrants from Uruguay | 3.7 /100 | #234 | Tragic 5.7% |
| Immigrants from Sudan | 3.5 /100 | #235 | Tragic 5.7% |
| Ghanaians | 3.3 /100 | #236 | Tragic 5.7% |
| Immigrants from South America | 3.1 /100 | #237 | Tragic 5.7% |
| Cherokee | 2.7 /100 | #238 | Tragic 5.8% |
Immigrants from Iraq Married-Couple Family Poverty Correlation Summary
| Measurement | Immigrants from Iraq Data | Married-Couple Family Poverty Data |
| Minimum | 0.030% | 1.9% |
| Maximum | 22.2% | 16.0% |
| Range | 22.1% | 14.2% |
| Mean | 3.7% | 5.9% |
| Median | 2.6% | 5.1% |
| Interquartile 25% (IQ1) | 1.3% | 4.2% |
| Interquartile 75% (IQ3) | 4.4% | 6.1% |
| Interquartile Range (IQR) | 3.1% | 1.9% |
| Standard Deviation (Sample) | 3.7% | 2.9% |
| Standard Deviation (Population) | 3.7% | 2.9% |
Correlation Details
| Immigrants from Iraq Percentile | Sample Size | Married-Couple Family Poverty |
[ 0.0% - 0.5% ] 0.030% | 91,469,745 | 5.3% |
[ 0.0% - 0.5% ] 0.097% | 38,014,393 | 4.8% |
[ 0.0% - 0.5% ] 0.16% | 22,552,683 | 5.1% |
[ 0.0% - 0.5% ] 0.23% | 11,004,036 | 5.5% |
[ 0.0% - 0.5% ] 0.29% | 6,925,918 | 4.3% |
[ 0.0% - 0.5% ] 0.36% | 3,887,098 | 3.5% |
[ 0.0% - 0.5% ] 0.43% | 3,386,144 | 4.6% |
[ 0.0% - 0.5% ] 0.49% | 2,257,728 | 4.4% |
[ 0.5% - 1.0% ] 0.56% | 1,321,601 | 5.6% |
[ 0.5% - 1.0% ] 0.63% | 1,572,175 | 4.7% |
[ 0.5% - 1.0% ] 0.69% | 2,248,752 | 4.9% |
[ 0.5% - 1.0% ] 0.75% | 820,101 | 4.1% |
[ 0.5% - 1.0% ] 0.82% | 834,189 | 5.7% |
[ 0.5% - 1.0% ] 0.89% | 698,858 | 5.3% |
[ 0.5% - 1.0% ] 0.96% | 923,200 | 4.1% |
[ 1.0% - 1.5% ] 1.01% | 507,688 | 4.3% |
[ 1.0% - 1.5% ] 1.09% | 434,001 | 7.5% |
[ 1.0% - 1.5% ] 1.15% | 648,151 | 5.1% |
[ 1.0% - 1.5% ] 1.21% | 295,623 | 4.9% |
[ 1.0% - 1.5% ] 1.28% | 321,475 | 4.7% |
[ 1.0% - 1.5% ] 1.36% | 169,746 | 3.4% |
[ 1.0% - 1.5% ] 1.41% | 181,761 | 5.5% |
[ 1.0% - 1.5% ] 1.49% | 253,664 | 8.2% |
[ 1.5% - 2.0% ] 1.53% | 94,650 | 9.0% |
[ 1.5% - 2.0% ] 1.60% | 38,227 | 3.1% |
[ 1.5% - 2.0% ] 1.66% | 106,999 | 9.8% |
[ 1.5% - 2.0% ] 1.75% | 60,659 | 4.6% |
[ 1.5% - 2.0% ] 1.81% | 122,425 | 3.5% |
[ 1.5% - 2.0% ] 1.88% | 69,040 | 1.9% |
[ 1.5% - 2.0% ] 1.93% | 131,150 | 13.0% |
[ 2.0% - 2.5% ] 2.01% | 222,859 | 5.2% |
[ 2.0% - 2.5% ] 2.07% | 109,104 | 4.8% |
[ 2.0% - 2.5% ] 2.12% | 71,140 | 3.9% |
[ 2.0% - 2.5% ] 2.20% | 115,707 | 2.8% |
[ 2.0% - 2.5% ] 2.28% | 65,411 | 6.0% |
[ 2.0% - 2.5% ] 2.34% | 49,287 | 5.0% |
[ 2.0% - 2.5% ] 2.39% | 3,261 | 7.3% |
[ 2.0% - 2.5% ] 2.48% | 13,960 | 5.5% |
[ 2.5% - 3.0% ] 2.56% | 130,976 | 3.7% |
[ 2.5% - 3.0% ] 2.60% | 65,411 | 4.2% |
[ 2.5% - 3.0% ] 2.68% | 115,504 | 5.1% |
[ 2.5% - 3.0% ] 2.71% | 30,637 | 5.5% |
[ 2.5% - 3.0% ] 2.81% | 74,389 | 9.2% |
[ 2.5% - 3.0% ] 2.88% | 130,465 | 16.0% |
[ 2.5% - 3.0% ] 2.98% | 238,915 | 5.8% |
[ 3.0% - 3.5% ] 3.08% | 3,864 | 4.7% |
[ 3.0% - 3.5% ] 3.14% | 509 | 5.1% |
[ 3.0% - 3.5% ] 3.26% | 54,569 | 9.3% |
[ 3.0% - 3.5% ] 3.34% | 7,444 | 7.7% |
[ 3.0% - 3.5% ] 3.44% | 110,117 | 3.4% |
[ 3.5% - 4.0% ] 3.54% | 21,468 | 5.2% |
[ 3.5% - 4.0% ] 3.58% | 36,981 | 4.7% |
[ 3.5% - 4.0% ] 3.62% | 15,017 | 9.9% |
[ 3.5% - 4.0% ] 3.75% | 33,170 | 6.0% |
[ 3.5% - 4.0% ] 3.85% | 67,076 | 5.7% |
[ 3.5% - 4.0% ] 3.91% | 74,049 | 6.2% |
[ 4.0% - 4.5% ] 4.05% | 62,474 | 15.1% |
[ 4.0% - 4.5% ] 4.08% | 25,051 | 2.8% |
[ 4.0% - 4.5% ] 4.30% | 16,850 | 3.1% |
[ 4.0% - 4.5% ] 4.36% | 9,951 | 4.2% |
[ 4.0% - 4.5% ] 4.43% | 16,742 | 4.3% |
[ 4.5% - 5.0% ] 4.56% | 57,421 | 5.3% |
[ 4.5% - 5.0% ] 4.60% | 6,018 | 5.2% |
[ 4.5% - 5.0% ] 4.67% | 214 | 13.6% |
[ 4.5% - 5.0% ] 4.91% | 30,802 | 5.6% |
[ 5.0% - 5.5% ] 5.16% | 63,085 | 11.4% |
[ 5.0% - 5.5% ] 5.42% | 22,152 | 2.8% |
[ 5.5% - 6.0% ] 5.78% | 34,004 | 5.0% |
[ 6.5% - 7.0% ] 6.61% | 27,848 | 8.5% |
[ 7.0% - 7.5% ] 7.05% | 69,638 | 8.0% |
[ 7.0% - 7.5% ] 7.14% | 4,525 | 3.7% |
[ 9.5% - 10.0% ] 9.58% | 21,587 | 4.1% |
[ 10.0% - 10.5% ] 10.17% | 22,430 | 3.4% |
[ 10.0% - 10.5% ] 10.48% | 33,174 | 2.8% |
[ 10.5% - 11.0% ] 10.54% | 45,937 | 5.2% |
[ 11.0% - 11.5% ] 11.30% | 34,921 | 4.1% |
[ 11.5% - 12.0% ] 11.80% | 59,775 | 11.2% |
[ 12.0% - 12.5% ] 12.19% | 105,721 | 12.5% |
[ 13.0% - 13.5% ] 13.14% | 133,744 | 5.6% |
[ 22.0% - 22.5% ] 22.18% | 43,232 | 8.1% |