Immigrants from Iraq GED/Equivalency
COMPARE
Immigrants from Iraq
Select to Compare
GED/Equivalency
Immigrants from Iraq GED/Equivalency
86.1%
GED/EQUIVALENCY
68.1/ 100
METRIC RATING
162nd/ 347
METRIC RANK
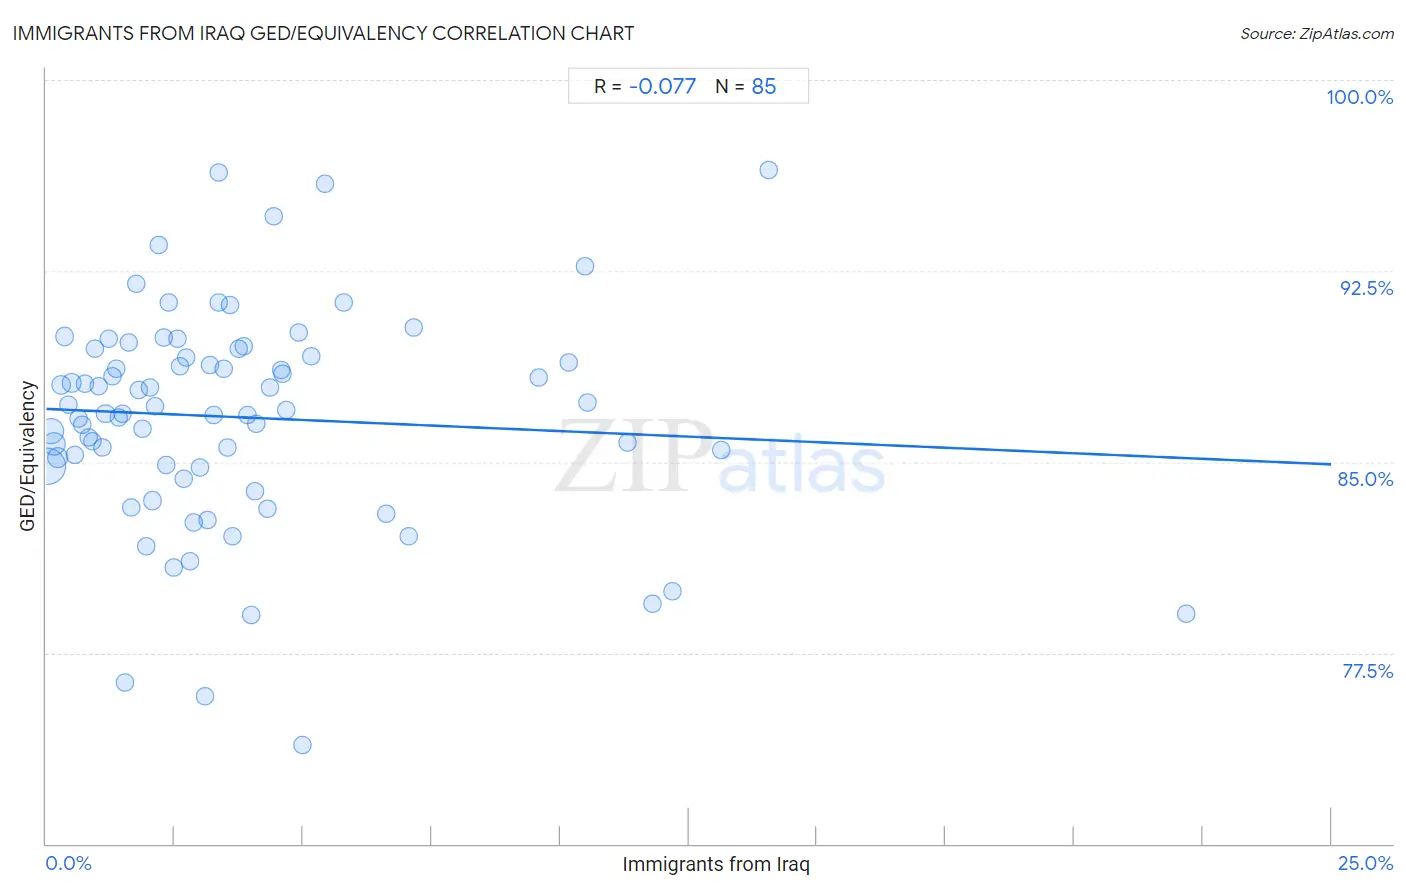
Immigrants from Iraq GED/Equivalency Correlation Chart
The statistical analysis conducted on geographies consisting of 194,780,026 people shows a slight negative correlation between the proportion of Immigrants from Iraq and percentage of population with at least ged/equivalency education in the United States with a correlation coefficient (R) of -0.077 and weighted average of 86.1%. On average, for every 1% (one percent) increase in Immigrants from Iraq within a typical geography, there is a decrease of 0.087% in percentage of population with at least ged/equivalency education.
It is essential to understand that the correlation between the percentage of Immigrants from Iraq and percentage of population with at least ged/equivalency education does not imply a direct cause-and-effect relationship. It remains uncertain whether the presence of Immigrants from Iraq influences an upward or downward trend in the level of percentage of population with at least ged/equivalency education within an area, or if Immigrants from Iraq simply ended up residing in those areas with higher or lower levels of percentage of population with at least ged/equivalency education due to other factors.
Demographics Similar to Immigrants from Iraq by GED/Equivalency
In terms of ged/equivalency, the demographic groups most similar to Immigrants from Iraq are Immigrants from Morocco (86.1%, a difference of 0.030%), Immigrants from Syria (86.1%, a difference of 0.030%), Ugandan (86.1%, a difference of 0.040%), Venezuelan (86.0%, a difference of 0.060%), and Immigrants from Kenya (86.2%, a difference of 0.090%).
| Demographics | Rating | Rank | GED/Equivalency |
| Iraqis | 75.2 /100 | #155 | Good 86.2% |
| Immigrants from Nepal | 73.3 /100 | #156 | Good 86.2% |
| Whites/Caucasians | 72.2 /100 | #157 | Good 86.2% |
| German Russians | 72.1 /100 | #158 | Good 86.2% |
| Immigrants from Kenya | 71.8 /100 | #159 | Good 86.2% |
| Immigrants from Morocco | 69.5 /100 | #160 | Good 86.1% |
| Immigrants from Syria | 69.3 /100 | #161 | Good 86.1% |
| Immigrants from Iraq | 68.1 /100 | #162 | Good 86.1% |
| Ugandans | 66.3 /100 | #163 | Good 86.1% |
| Venezuelans | 65.5 /100 | #164 | Good 86.0% |
| Alsatians | 64.3 /100 | #165 | Good 86.0% |
| Immigrants from Albania | 64.2 /100 | #166 | Good 86.0% |
| Ethiopians | 63.7 /100 | #167 | Good 86.0% |
| Sierra Leoneans | 61.8 /100 | #168 | Good 86.0% |
| Immigrants from Ethiopia | 61.2 /100 | #169 | Good 86.0% |
Immigrants from Iraq GED/Equivalency Correlation Summary
| Measurement | Immigrants from Iraq Data | GED/Equivalency Data |
| Minimum | 0.030% | 73.9% |
| Maximum | 22.2% | 96.5% |
| Range | 22.1% | 22.6% |
| Mean | 3.8% | 86.7% |
| Median | 2.8% | 87.0% |
| Interquartile 25% (IQ1) | 1.4% | 84.8% |
| Interquartile 75% (IQ3) | 4.5% | 89.3% |
| Interquartile Range (IQR) | 3.1% | 4.5% |
| Standard Deviation (Sample) | 3.8% | 4.3% |
| Standard Deviation (Population) | 3.8% | 4.3% |
Correlation Details
| Immigrants from Iraq Percentile | Sample Size | GED/Equivalency |
[ 0.0% - 0.5% ] 0.030% | 91,504,890 | 84.8% |
[ 0.0% - 0.5% ] 0.097% | 38,092,213 | 86.2% |
[ 0.0% - 0.5% ] 0.16% | 22,618,275 | 85.7% |
[ 0.0% - 0.5% ] 0.23% | 11,086,541 | 85.2% |
[ 0.0% - 0.5% ] 0.29% | 7,005,768 | 88.0% |
[ 0.0% - 0.5% ] 0.36% | 3,911,694 | 89.9% |
[ 0.0% - 0.5% ] 0.43% | 3,414,224 | 87.2% |
[ 0.0% - 0.5% ] 0.49% | 2,275,809 | 88.1% |
[ 0.5% - 1.0% ] 0.56% | 1,347,645 | 85.3% |
[ 0.5% - 1.0% ] 0.63% | 1,574,200 | 86.7% |
[ 0.5% - 1.0% ] 0.69% | 2,256,195 | 86.5% |
[ 0.5% - 1.0% ] 0.75% | 831,674 | 88.1% |
[ 0.5% - 1.0% ] 0.82% | 845,468 | 85.9% |
[ 0.5% - 1.0% ] 0.89% | 707,916 | 85.8% |
[ 0.5% - 1.0% ] 0.96% | 926,200 | 89.4% |
[ 1.0% - 1.5% ] 1.01% | 526,038 | 88.0% |
[ 1.0% - 1.5% ] 1.09% | 435,698 | 85.6% |
[ 1.0% - 1.5% ] 1.15% | 658,973 | 86.9% |
[ 1.0% - 1.5% ] 1.21% | 306,915 | 89.8% |
[ 1.0% - 1.5% ] 1.28% | 328,050 | 88.4% |
[ 1.0% - 1.5% ] 1.36% | 172,086 | 88.7% |
[ 1.0% - 1.5% ] 1.41% | 183,610 | 86.7% |
[ 1.0% - 1.5% ] 1.49% | 253,664 | 86.9% |
[ 1.5% - 2.0% ] 1.53% | 94,650 | 76.3% |
[ 1.5% - 2.0% ] 1.60% | 38,227 | 89.7% |
[ 1.5% - 2.0% ] 1.66% | 106,999 | 83.2% |
[ 1.5% - 2.0% ] 1.75% | 60,889 | 92.0% |
[ 1.5% - 2.0% ] 1.81% | 123,641 | 87.8% |
[ 1.5% - 2.0% ] 1.88% | 71,744 | 86.3% |
[ 1.5% - 2.0% ] 1.93% | 131,150 | 81.7% |
[ 2.0% - 2.5% ] 2.01% | 222,859 | 87.9% |
[ 2.0% - 2.5% ] 2.07% | 109,104 | 83.5% |
[ 2.0% - 2.5% ] 2.12% | 71,140 | 87.2% |
[ 2.0% - 2.5% ] 2.20% | 115,707 | 93.5% |
[ 2.0% - 2.5% ] 2.28% | 66,618 | 89.9% |
[ 2.0% - 2.5% ] 2.34% | 49,287 | 84.9% |
[ 2.0% - 2.5% ] 2.39% | 3,261 | 91.3% |
[ 2.0% - 2.5% ] 2.48% | 19,258 | 80.9% |
[ 2.5% - 3.0% ] 2.56% | 132,048 | 89.9% |
[ 2.5% - 3.0% ] 2.60% | 65,411 | 88.8% |
[ 2.5% - 3.0% ] 2.68% | 115,504 | 84.3% |
[ 2.5% - 3.0% ] 2.72% | 41,902 | 89.1% |
[ 2.5% - 3.0% ] 2.81% | 74,389 | 81.1% |
[ 2.5% - 3.0% ] 2.88% | 130,465 | 82.6% |
[ 2.5% - 3.0% ] 2.98% | 238,915 | 84.8% |
[ 3.0% - 3.5% ] 3.08% | 4,028 | 75.8% |
[ 3.0% - 3.5% ] 3.14% | 509 | 82.7% |
[ 3.0% - 3.5% ] 3.19% | 251 | 88.8% |
[ 3.0% - 3.5% ] 3.25% | 58,572 | 86.8% |
[ 3.0% - 3.5% ] 3.34% | 7,444 | 91.3% |
[ 3.0% - 3.5% ] 3.36% | 1,102 | 96.4% |
[ 3.0% - 3.5% ] 3.44% | 110,117 | 88.6% |
[ 3.5% - 4.0% ] 3.54% | 21,468 | 85.5% |
[ 3.5% - 4.0% ] 3.58% | 36,981 | 91.2% |
[ 3.5% - 4.0% ] 3.62% | 15,017 | 82.1% |
[ 3.5% - 4.0% ] 3.75% | 33,170 | 89.5% |
[ 3.5% - 4.0% ] 3.85% | 67,076 | 89.5% |
[ 3.5% - 4.0% ] 3.91% | 74,049 | 86.9% |
[ 3.5% - 4.0% ] 4.00% | 2,803 | 79.0% |
[ 4.0% - 4.5% ] 4.05% | 62,474 | 83.8% |
[ 4.0% - 4.5% ] 4.08% | 25,051 | 86.5% |
[ 4.0% - 4.5% ] 4.30% | 16,850 | 83.1% |
[ 4.0% - 4.5% ] 4.36% | 9,951 | 87.9% |
[ 4.0% - 4.5% ] 4.43% | 16,742 | 94.7% |
[ 4.5% - 5.0% ] 4.56% | 57,421 | 88.6% |
[ 4.5% - 5.0% ] 4.60% | 6,018 | 88.5% |
[ 4.5% - 5.0% ] 4.67% | 214 | 87.0% |
[ 4.5% - 5.0% ] 4.91% | 30,802 | 90.1% |
[ 4.5% - 5.0% ] 4.98% | 53,044 | 73.9% |
[ 5.0% - 5.5% ] 5.16% | 63,085 | 89.1% |
[ 5.0% - 5.5% ] 5.42% | 22,152 | 95.9% |
[ 5.5% - 6.0% ] 5.78% | 34,004 | 91.3% |
[ 6.5% - 7.0% ] 6.61% | 27,848 | 83.0% |
[ 7.0% - 7.5% ] 7.05% | 69,638 | 82.1% |
[ 7.0% - 7.5% ] 7.14% | 4,525 | 90.3% |
[ 9.5% - 10.0% ] 9.58% | 21,587 | 88.3% |
[ 10.0% - 10.5% ] 10.17% | 22,430 | 88.9% |
[ 10.0% - 10.5% ] 10.48% | 33,174 | 92.7% |
[ 10.5% - 11.0% ] 10.54% | 45,937 | 87.4% |
[ 11.0% - 11.5% ] 11.30% | 34,921 | 85.7% |
[ 11.5% - 12.0% ] 11.80% | 59,775 | 79.4% |
[ 12.0% - 12.5% ] 12.19% | 105,721 | 79.9% |
[ 13.0% - 13.5% ] 13.14% | 133,744 | 85.5% |
[ 14.0% - 14.5% ] 14.05% | 185 | 96.5% |
[ 22.0% - 22.5% ] 22.18% | 43,232 | 79.0% |