Immigrants from Iraq 3 or more Vehicles in Household
COMPARE
Immigrants from Iraq
Select to Compare
3 or more Vehicles in Household
Immigrants from Iraq 3 or more Vehicles in Household
20.2%
3+ VEHICLES AVAILABLE
87.1/ 100
METRIC RATING
137th/ 347
METRIC RANK
Immigrants from Iraq 3 or more Vehicles in Household Correlation Chart
The statistical analysis conducted on geographies consisting of 194,713,443 people shows a weak positive correlation between the proportion of Immigrants from Iraq and percentage of households with 3 or more vehicles available in the United States with a correlation coefficient (R) of 0.215 and weighted average of 20.2%. On average, for every 1% (one percent) increase in Immigrants from Iraq within a typical geography, there is an increase of 0.29% in percentage of households with 3 or more vehicles available.
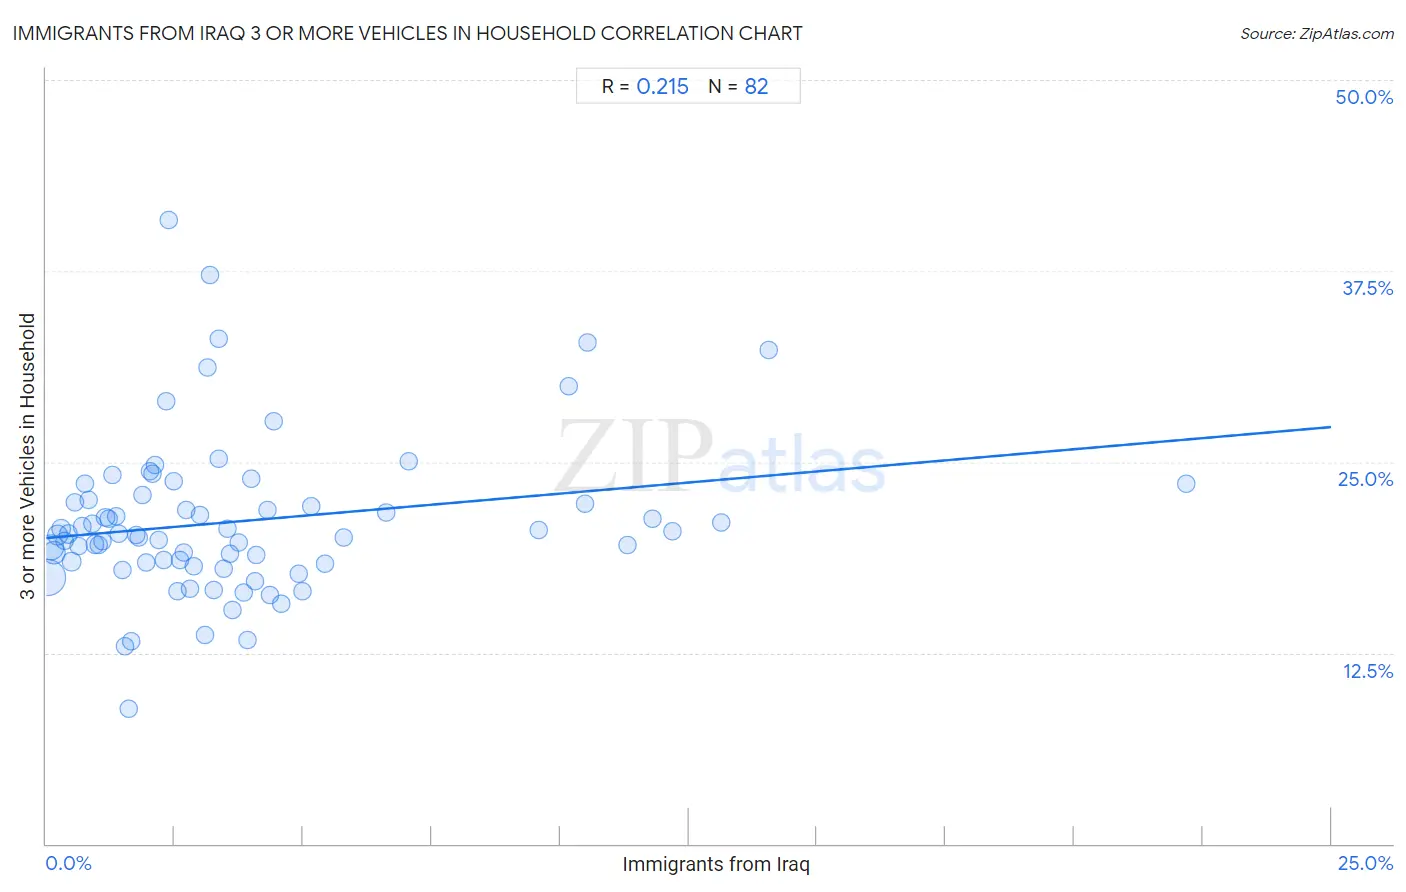
It is essential to understand that the correlation between the percentage of Immigrants from Iraq and percentage of households with 3 or more vehicles available does not imply a direct cause-and-effect relationship. It remains uncertain whether the presence of Immigrants from Iraq influences an upward or downward trend in the level of percentage of households with 3 or more vehicles available within an area, or if Immigrants from Iraq simply ended up residing in those areas with higher or lower levels of percentage of households with 3 or more vehicles available due to other factors.
Demographics Similar to Immigrants from Iraq by 3 or more Vehicles in Household
In terms of 3 or more vehicles in household, the demographic groups most similar to Immigrants from Iraq are Immigrants from Nicaragua (20.2%, a difference of 0.0%), Immigrants from India (20.2%, a difference of 0.010%), Polish (20.2%, a difference of 0.040%), Immigrants from North America (20.2%, a difference of 0.12%), and Aleut (20.2%, a difference of 0.12%).
| Demographics | Rating | Rank | 3 or more Vehicles in Household |
| Greeks | 88.6 /100 | #130 | Excellent 20.3% |
| Immigrants from Asia | 88.1 /100 | #131 | Excellent 20.2% |
| Immigrants from Canada | 87.8 /100 | #132 | Excellent 20.2% |
| Immigrants from North America | 87.8 /100 | #133 | Excellent 20.2% |
| Poles | 87.3 /100 | #134 | Excellent 20.2% |
| Immigrants from India | 87.2 /100 | #135 | Excellent 20.2% |
| Immigrants from Nicaragua | 87.1 /100 | #136 | Excellent 20.2% |
| Immigrants from Iraq | 87.1 /100 | #137 | Excellent 20.2% |
| Aleuts | 86.3 /100 | #138 | Excellent 20.2% |
| Slovenes | 85.5 /100 | #139 | Excellent 20.2% |
| French American Indians | 85.3 /100 | #140 | Excellent 20.1% |
| Ottawa | 84.9 /100 | #141 | Excellent 20.1% |
| Jordanians | 84.4 /100 | #142 | Excellent 20.1% |
| Lithuanians | 84.4 /100 | #143 | Excellent 20.1% |
| Iranians | 84.0 /100 | #144 | Excellent 20.1% |
Immigrants from Iraq 3 or more Vehicles in Household Correlation Summary
| Measurement | Immigrants from Iraq Data | 3 or more Vehicles in Household Data |
| Minimum | 0.030% | 8.9% |
| Maximum | 22.2% | 40.8% |
| Range | 22.1% | 32.0% |
| Mean | 3.7% | 21.1% |
| Median | 2.7% | 20.2% |
| Interquartile 25% (IQ1) | 1.4% | 18.4% |
| Interquartile 75% (IQ3) | 4.3% | 22.5% |
| Interquartile Range (IQR) | 2.9% | 4.2% |
| Standard Deviation (Sample) | 3.8% | 5.2% |
| Standard Deviation (Population) | 3.8% | 5.2% |
Correlation Details
| Immigrants from Iraq Percentile | Sample Size | 3 or more Vehicles in Household |
[ 0.0% - 0.5% ] 0.030% | 91,502,846 | 17.4% |
[ 0.0% - 0.5% ] 0.097% | 38,082,335 | 19.4% |
[ 0.0% - 0.5% ] 0.16% | 22,618,275 | 19.0% |
[ 0.0% - 0.5% ] 0.23% | 11,071,041 | 20.2% |
[ 0.0% - 0.5% ] 0.29% | 7,005,768 | 20.7% |
[ 0.0% - 0.5% ] 0.36% | 3,911,694 | 19.8% |
[ 0.0% - 0.5% ] 0.43% | 3,410,085 | 20.3% |
[ 0.0% - 0.5% ] 0.49% | 2,275,809 | 18.5% |
[ 0.5% - 1.0% ] 0.56% | 1,331,247 | 22.3% |
[ 0.5% - 1.0% ] 0.63% | 1,574,200 | 19.5% |
[ 0.5% - 1.0% ] 0.69% | 2,256,195 | 20.8% |
[ 0.5% - 1.0% ] 0.75% | 828,782 | 23.6% |
[ 0.5% - 1.0% ] 0.82% | 845,468 | 22.5% |
[ 0.5% - 1.0% ] 0.89% | 705,106 | 20.9% |
[ 0.5% - 1.0% ] 0.96% | 926,200 | 19.6% |
[ 1.0% - 1.5% ] 1.01% | 526,038 | 19.6% |
[ 1.0% - 1.5% ] 1.09% | 434,001 | 19.8% |
[ 1.0% - 1.5% ] 1.15% | 658,973 | 21.4% |
[ 1.0% - 1.5% ] 1.21% | 306,915 | 21.3% |
[ 1.0% - 1.5% ] 1.28% | 328,050 | 24.1% |
[ 1.0% - 1.5% ] 1.36% | 172,086 | 21.4% |
[ 1.0% - 1.5% ] 1.41% | 183,610 | 20.3% |
[ 1.0% - 1.5% ] 1.49% | 253,196 | 17.9% |
[ 1.5% - 2.0% ] 1.53% | 94,650 | 12.9% |
[ 1.5% - 2.0% ] 1.60% | 38,227 | 8.9% |
[ 1.5% - 2.0% ] 1.66% | 106,999 | 13.3% |
[ 1.5% - 2.0% ] 1.75% | 60,889 | 20.2% |
[ 1.5% - 2.0% ] 1.81% | 123,641 | 20.1% |
[ 1.5% - 2.0% ] 1.88% | 71,744 | 22.8% |
[ 1.5% - 2.0% ] 1.93% | 131,150 | 18.4% |
[ 2.0% - 2.5% ] 2.01% | 222,859 | 24.4% |
[ 2.0% - 2.5% ] 2.07% | 109,104 | 24.2% |
[ 2.0% - 2.5% ] 2.12% | 71,140 | 24.8% |
[ 2.0% - 2.5% ] 2.20% | 115,707 | 19.9% |
[ 2.0% - 2.5% ] 2.28% | 66,618 | 18.6% |
[ 2.0% - 2.5% ] 2.34% | 49,287 | 29.0% |
[ 2.0% - 2.5% ] 2.39% | 3,261 | 40.8% |
[ 2.0% - 2.5% ] 2.48% | 19,258 | 23.7% |
[ 2.5% - 3.0% ] 2.56% | 132,048 | 16.6% |
[ 2.5% - 3.0% ] 2.60% | 65,411 | 18.6% |
[ 2.5% - 3.0% ] 2.68% | 115,504 | 19.0% |
[ 2.5% - 3.0% ] 2.72% | 41,902 | 21.8% |
[ 2.5% - 3.0% ] 2.81% | 74,389 | 16.7% |
[ 2.5% - 3.0% ] 2.88% | 130,465 | 18.1% |
[ 2.5% - 3.0% ] 2.98% | 238,915 | 21.6% |
[ 3.0% - 3.5% ] 3.08% | 4,028 | 13.7% |
[ 3.0% - 3.5% ] 3.14% | 509 | 31.2% |
[ 3.0% - 3.5% ] 3.19% | 251 | 37.2% |
[ 3.0% - 3.5% ] 3.25% | 58,572 | 16.6% |
[ 3.0% - 3.5% ] 3.34% | 7,444 | 25.2% |
[ 3.0% - 3.5% ] 3.36% | 1,102 | 33.1% |
[ 3.0% - 3.5% ] 3.44% | 110,117 | 18.0% |
[ 3.5% - 4.0% ] 3.54% | 21,468 | 20.6% |
[ 3.5% - 4.0% ] 3.58% | 36,981 | 18.9% |
[ 3.5% - 4.0% ] 3.62% | 15,017 | 15.3% |
[ 3.5% - 4.0% ] 3.75% | 33,170 | 19.7% |
[ 3.5% - 4.0% ] 3.85% | 67,076 | 16.4% |
[ 3.5% - 4.0% ] 3.91% | 74,049 | 13.4% |
[ 3.5% - 4.0% ] 4.00% | 2,803 | 23.9% |
[ 4.0% - 4.5% ] 4.05% | 62,474 | 17.2% |
[ 4.0% - 4.5% ] 4.08% | 25,051 | 18.9% |
[ 4.0% - 4.5% ] 4.30% | 16,850 | 21.9% |
[ 4.0% - 4.5% ] 4.36% | 9,951 | 16.3% |
[ 4.0% - 4.5% ] 4.43% | 16,742 | 27.7% |
[ 4.5% - 5.0% ] 4.56% | 57,421 | 15.7% |
[ 4.5% - 5.0% ] 4.91% | 30,802 | 17.7% |
[ 4.5% - 5.0% ] 4.98% | 53,044 | 16.5% |
[ 5.0% - 5.5% ] 5.16% | 63,085 | 22.1% |
[ 5.0% - 5.5% ] 5.42% | 22,152 | 18.3% |
[ 5.5% - 6.0% ] 5.78% | 34,004 | 20.1% |
[ 6.5% - 7.0% ] 6.61% | 27,848 | 21.7% |
[ 7.0% - 7.5% ] 7.05% | 69,638 | 25.0% |
[ 9.5% - 10.0% ] 9.58% | 21,587 | 20.5% |
[ 10.0% - 10.5% ] 10.17% | 22,430 | 30.0% |
[ 10.0% - 10.5% ] 10.48% | 33,174 | 22.3% |
[ 10.5% - 11.0% ] 10.54% | 45,937 | 32.8% |
[ 11.0% - 11.5% ] 11.30% | 34,921 | 19.6% |
[ 11.5% - 12.0% ] 11.80% | 59,775 | 21.2% |
[ 12.0% - 12.5% ] 12.19% | 105,721 | 20.4% |
[ 13.0% - 13.5% ] 13.14% | 133,744 | 21.0% |
[ 14.0% - 14.5% ] 14.05% | 185 | 32.4% |
[ 22.0% - 22.5% ] 22.18% | 43,232 | 23.5% |