Central American College, Under 1 year
COMPARE
Central American
Select to Compare
College, Under 1 year
Central American College, Under 1 year
57.7%
COLLEGE, UNDER 1 YEAR
0.0/ 100
METRIC RATING
308th/ 347
METRIC RANK
Central American College, Under 1 year Correlation Chart
The statistical analysis conducted on geographies consisting of 504,615,987 people shows a strong negative correlation between the proportion of Central Americans and percentage of population with at least college, under 1 year education in the United States with a correlation coefficient (R) of -0.734 and weighted average of 57.7%. On average, for every 1% (one percent) increase in Central Americans within a typical geography, there is a decrease of 0.54% in percentage of population with at least college, under 1 year education.
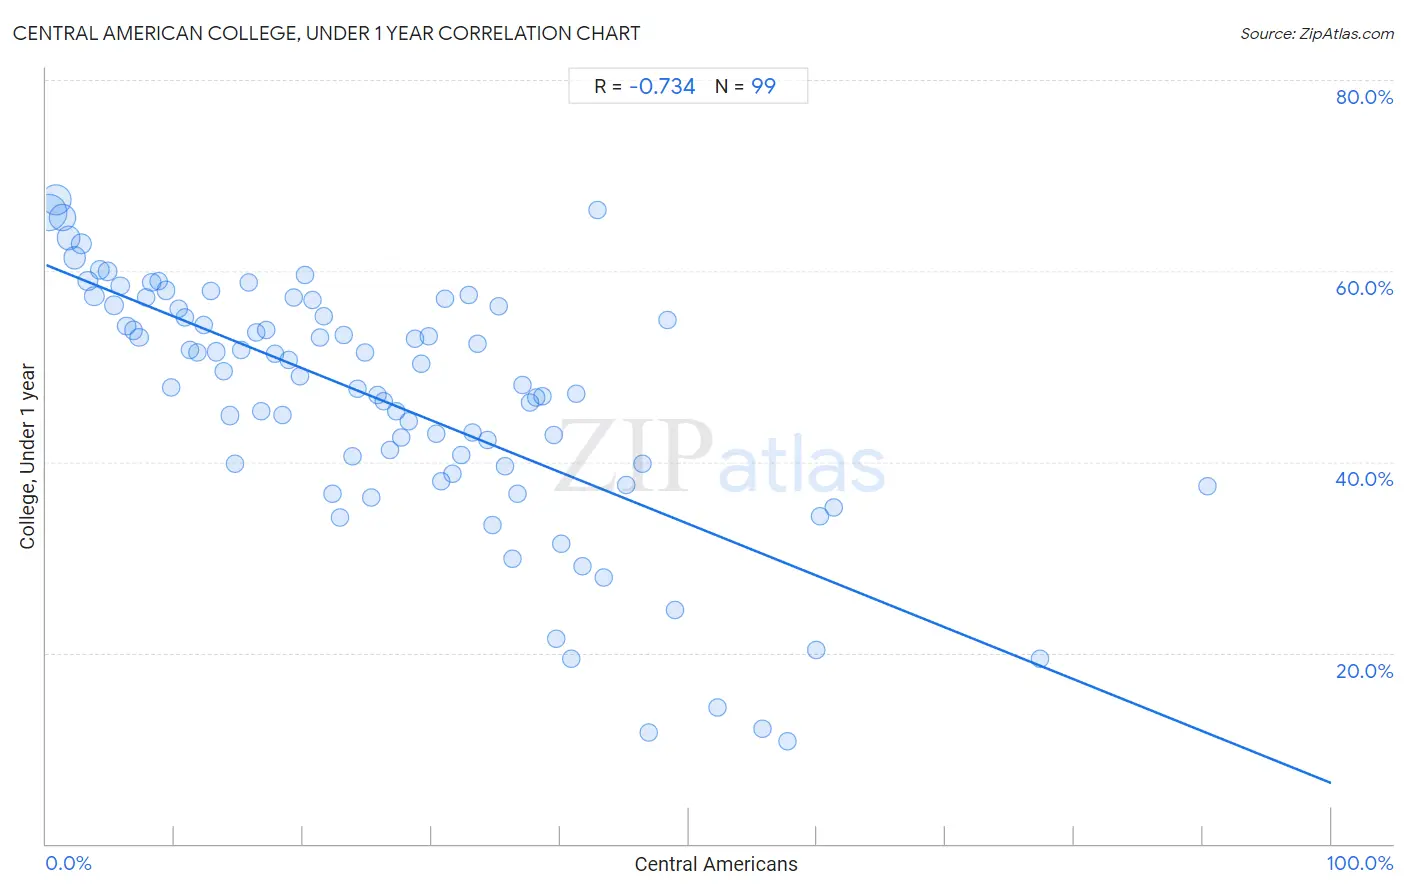
It is essential to understand that the correlation between the percentage of Central Americans and percentage of population with at least college, under 1 year education does not imply a direct cause-and-effect relationship. It remains uncertain whether the presence of Central Americans influences an upward or downward trend in the level of percentage of population with at least college, under 1 year education within an area, or if Central Americans simply ended up residing in those areas with higher or lower levels of percentage of population with at least college, under 1 year education due to other factors.
Demographics Similar to Central Americans by College, Under 1 year
In terms of college, under 1 year, the demographic groups most similar to Central Americans are Fijian (57.7%, a difference of 0.0%), Immigrants from Portugal (57.7%, a difference of 0.010%), Immigrants from Nicaragua (57.6%, a difference of 0.12%), Haitian (57.8%, a difference of 0.21%), and Kiowa (57.8%, a difference of 0.32%).
| Demographics | Rating | Rank | College, Under 1 year |
| Mexican American Indians | 0.0 /100 | #301 | Tragic 58.1% |
| Apache | 0.0 /100 | #302 | Tragic 58.0% |
| Immigrants from Dominica | 0.0 /100 | #303 | Tragic 57.9% |
| Kiowa | 0.0 /100 | #304 | Tragic 57.8% |
| Haitians | 0.0 /100 | #305 | Tragic 57.8% |
| Immigrants from Portugal | 0.0 /100 | #306 | Tragic 57.7% |
| Fijians | 0.0 /100 | #307 | Tragic 57.7% |
| Central Americans | 0.0 /100 | #308 | Tragic 57.7% |
| Immigrants from Nicaragua | 0.0 /100 | #309 | Tragic 57.6% |
| Pueblo | 0.0 /100 | #310 | Tragic 57.4% |
| Cajuns | 0.0 /100 | #311 | Tragic 57.3% |
| Salvadorans | 0.0 /100 | #312 | Tragic 57.3% |
| Dutch West Indians | 0.0 /100 | #313 | Tragic 57.2% |
| Hopi | 0.0 /100 | #314 | Tragic 57.1% |
| Hondurans | 0.0 /100 | #315 | Tragic 57.1% |
Central American College, Under 1 year Correlation Summary
| Measurement | Central American Data | College, Under 1 year Data |
| Minimum | 0.24% | 10.7% |
| Maximum | 90.3% | 67.5% |
| Range | 90.1% | 56.8% |
| Mean | 26.3% | 46.4% |
| Median | 24.8% | 48.9% |
| Interquartile 25% (IQ1) | 12.2% | 39.6% |
| Interquartile 75% (IQ3) | 37.0% | 56.3% |
| Interquartile Range (IQR) | 24.8% | 16.7% |
| Standard Deviation (Sample) | 17.5% | 13.0% |
| Standard Deviation (Population) | 17.5% | 12.9% |
Correlation Details
| Central American Percentile | Sample Size | College, Under 1 year |
[ 0.0% - 0.5% ] 0.24% | 145,710,058 | 66.1% |
[ 0.5% - 1.0% ] 0.73% | 100,198,265 | 67.5% |
[ 1.0% - 1.5% ] 1.24% | 67,803,120 | 65.7% |
[ 1.5% - 2.0% ] 1.74% | 41,013,516 | 63.4% |
[ 2.0% - 2.5% ] 2.21% | 34,557,900 | 61.4% |
[ 2.5% - 3.0% ] 2.75% | 18,058,113 | 62.8% |
[ 3.0% - 3.5% ] 3.25% | 13,507,878 | 58.9% |
[ 3.5% - 4.0% ] 3.74% | 10,920,671 | 57.4% |
[ 4.0% - 4.5% ] 4.20% | 11,930,027 | 60.1% |
[ 4.5% - 5.0% ] 4.77% | 7,849,326 | 60.0% |
[ 5.0% - 5.5% ] 5.26% | 5,380,504 | 56.4% |
[ 5.5% - 6.0% ] 5.74% | 5,810,789 | 58.4% |
[ 6.0% - 6.5% ] 6.27% | 3,669,071 | 54.3% |
[ 6.5% - 7.0% ] 6.76% | 3,880,235 | 53.8% |
[ 7.0% - 7.5% ] 7.25% | 2,756,940 | 53.1% |
[ 7.5% - 8.0% ] 7.76% | 1,923,749 | 57.2% |
[ 8.0% - 8.5% ] 8.21% | 2,112,103 | 58.8% |
[ 8.5% - 9.0% ] 8.74% | 1,802,754 | 58.9% |
[ 9.0% - 9.5% ] 9.33% | 3,986,755 | 58.0% |
[ 9.5% - 10.0% ] 9.73% | 1,158,880 | 47.8% |
[ 10.0% - 10.5% ] 10.29% | 945,583 | 56.0% |
[ 10.5% - 11.0% ] 10.78% | 1,218,090 | 55.1% |
[ 11.0% - 11.5% ] 11.23% | 805,328 | 51.7% |
[ 11.5% - 12.0% ] 11.80% | 1,080,881 | 51.5% |
[ 12.0% - 12.5% ] 12.25% | 646,731 | 54.3% |
[ 12.5% - 13.0% ] 12.84% | 4,756,013 | 57.9% |
[ 13.0% - 13.5% ] 13.27% | 806,284 | 51.5% |
[ 13.5% - 14.0% ] 13.79% | 826,697 | 49.5% |
[ 14.0% - 14.5% ] 14.31% | 890,073 | 44.9% |
[ 14.5% - 15.0% ] 14.73% | 447,173 | 39.8% |
[ 15.0% - 15.5% ] 15.17% | 402,899 | 51.7% |
[ 15.5% - 16.0% ] 15.73% | 447,291 | 58.7% |
[ 16.0% - 16.5% ] 16.33% | 836,848 | 53.5% |
[ 16.5% - 17.0% ] 16.74% | 538,138 | 45.4% |
[ 17.0% - 17.5% ] 17.16% | 387,140 | 53.8% |
[ 17.5% - 18.0% ] 17.84% | 298,102 | 51.3% |
[ 18.0% - 18.5% ] 18.37% | 53,977 | 45.0% |
[ 18.5% - 19.0% ] 18.84% | 669,010 | 50.6% |
[ 19.0% - 19.5% ] 19.23% | 110,663 | 57.2% |
[ 19.5% - 20.0% ] 19.76% | 248,266 | 48.9% |
[ 20.0% - 20.5% ] 20.14% | 208,675 | 59.5% |
[ 20.5% - 21.0% ] 20.76% | 171,165 | 57.0% |
[ 21.0% - 21.5% ] 21.28% | 255,562 | 53.0% |
[ 21.5% - 22.0% ] 21.63% | 107,458 | 55.2% |
[ 22.0% - 22.5% ] 22.31% | 75,746 | 36.7% |
[ 22.5% - 23.0% ] 22.87% | 187,299 | 34.2% |
[ 23.0% - 23.5% ] 23.19% | 142,767 | 53.3% |
[ 23.5% - 24.0% ] 23.85% | 13,092 | 40.5% |
[ 24.0% - 24.5% ] 24.18% | 183,890 | 47.6% |
[ 24.5% - 25.0% ] 24.80% | 180,568 | 51.4% |
[ 25.0% - 25.5% ] 25.27% | 121,053 | 36.3% |
[ 25.5% - 26.0% ] 25.77% | 250,986 | 47.0% |
[ 26.0% - 26.5% ] 26.24% | 222,979 | 46.4% |
[ 26.5% - 27.0% ] 26.79% | 258,344 | 41.2% |
[ 27.0% - 27.5% ] 27.26% | 18,330 | 45.3% |
[ 27.5% - 28.0% ] 27.62% | 152,945 | 42.6% |
[ 28.0% - 28.5% ] 28.21% | 47,338 | 44.2% |
[ 28.5% - 29.0% ] 28.67% | 57,519 | 52.9% |
[ 29.0% - 29.5% ] 29.17% | 107,395 | 50.3% |
[ 29.5% - 30.0% ] 29.76% | 115,067 | 53.2% |
[ 30.0% - 30.5% ] 30.32% | 124,191 | 42.9% |
[ 30.5% - 31.0% ] 30.77% | 207,899 | 37.9% |
[ 31.0% - 31.5% ] 31.04% | 98,190 | 57.0% |
[ 31.5% - 32.0% ] 31.64% | 62,846 | 38.7% |
[ 32.0% - 32.5% ] 32.32% | 138,223 | 40.8% |
[ 32.5% - 33.0% ] 32.90% | 24,660 | 57.4% |
[ 33.0% - 33.5% ] 33.17% | 77,314 | 43.1% |
[ 33.5% - 34.0% ] 33.56% | 33,122 | 52.4% |
[ 34.0% - 34.5% ] 34.38% | 10,639 | 42.2% |
[ 34.5% - 35.0% ] 34.73% | 59,607 | 33.3% |
[ 35.0% - 35.5% ] 35.20% | 9,444 | 56.3% |
[ 35.5% - 36.0% ] 35.69% | 33,018 | 39.6% |
[ 36.0% - 36.5% ] 36.32% | 1,473 | 29.9% |
[ 36.5% - 37.0% ] 36.65% | 96,220 | 36.6% |
[ 37.0% - 37.5% ] 37.05% | 19,289 | 48.0% |
[ 37.5% - 38.0% ] 37.61% | 10,563 | 46.2% |
[ 38.0% - 38.5% ] 38.18% | 2,664 | 46.7% |
[ 38.5% - 39.0% ] 38.65% | 39,220 | 46.9% |
[ 39.0% - 39.5% ] 39.46% | 25,324 | 42.9% |
[ 39.5% - 40.0% ] 39.65% | 7,945 | 21.5% |
[ 40.0% - 40.5% ] 40.10% | 17,564 | 31.4% |
[ 40.5% - 41.0% ] 40.86% | 15,109 | 19.3% |
[ 41.0% - 41.5% ] 41.21% | 18,695 | 47.1% |
[ 41.5% - 42.0% ] 41.78% | 2,025 | 29.1% |
[ 42.5% - 43.0% ] 42.92% | 212 | 66.3% |
[ 43.0% - 43.5% ] 43.43% | 175 | 27.9% |
[ 45.0% - 45.5% ] 45.12% | 79,765 | 37.6% |
[ 46.0% - 46.5% ] 46.36% | 2,118 | 39.8% |
[ 46.5% - 47.0% ] 46.92% | 211 | 11.7% |
[ 48.0% - 48.5% ] 48.35% | 182 | 54.8% |
[ 48.5% - 49.0% ] 48.89% | 180 | 24.4% |
[ 52.0% - 52.5% ] 52.21% | 113 | 14.3% |
[ 55.5% - 56.0% ] 55.70% | 149 | 12.1% |
[ 57.5% - 58.0% ] 57.69% | 182 | 10.7% |
[ 59.5% - 60.0% ] 59.89% | 1,112 | 20.3% |
[ 60.0% - 60.5% ] 60.18% | 50,387 | 34.3% |
[ 61.0% - 61.5% ] 61.24% | 129 | 35.2% |
[ 77.0% - 77.5% ] 77.31% | 21,778 | 19.4% |
[ 90.0% - 90.5% ] 90.32% | 31 | 37.5% |