Central American Married-Couple Family Poverty
COMPARE
Central American
Select to Compare
Married-Couple Family Poverty
Central American Married-Couple Family Poverty
6.7%
POVERTY | MARRIED-COUPLE FAMILIES
0.0/ 100
METRIC RATING
301st/ 347
METRIC RANK
Central American Married-Couple Family Poverty Correlation Chart
The statistical analysis conducted on geographies consisting of 497,895,847 people shows a moderate positive correlation between the proportion of Central Americans and poverty level among married-couple families in the United States with a correlation coefficient (R) of 0.482 and weighted average of 6.7%. On average, for every 1% (one percent) increase in Central Americans within a typical geography, there is an increase of 0.20% in poverty level among married-couple families.
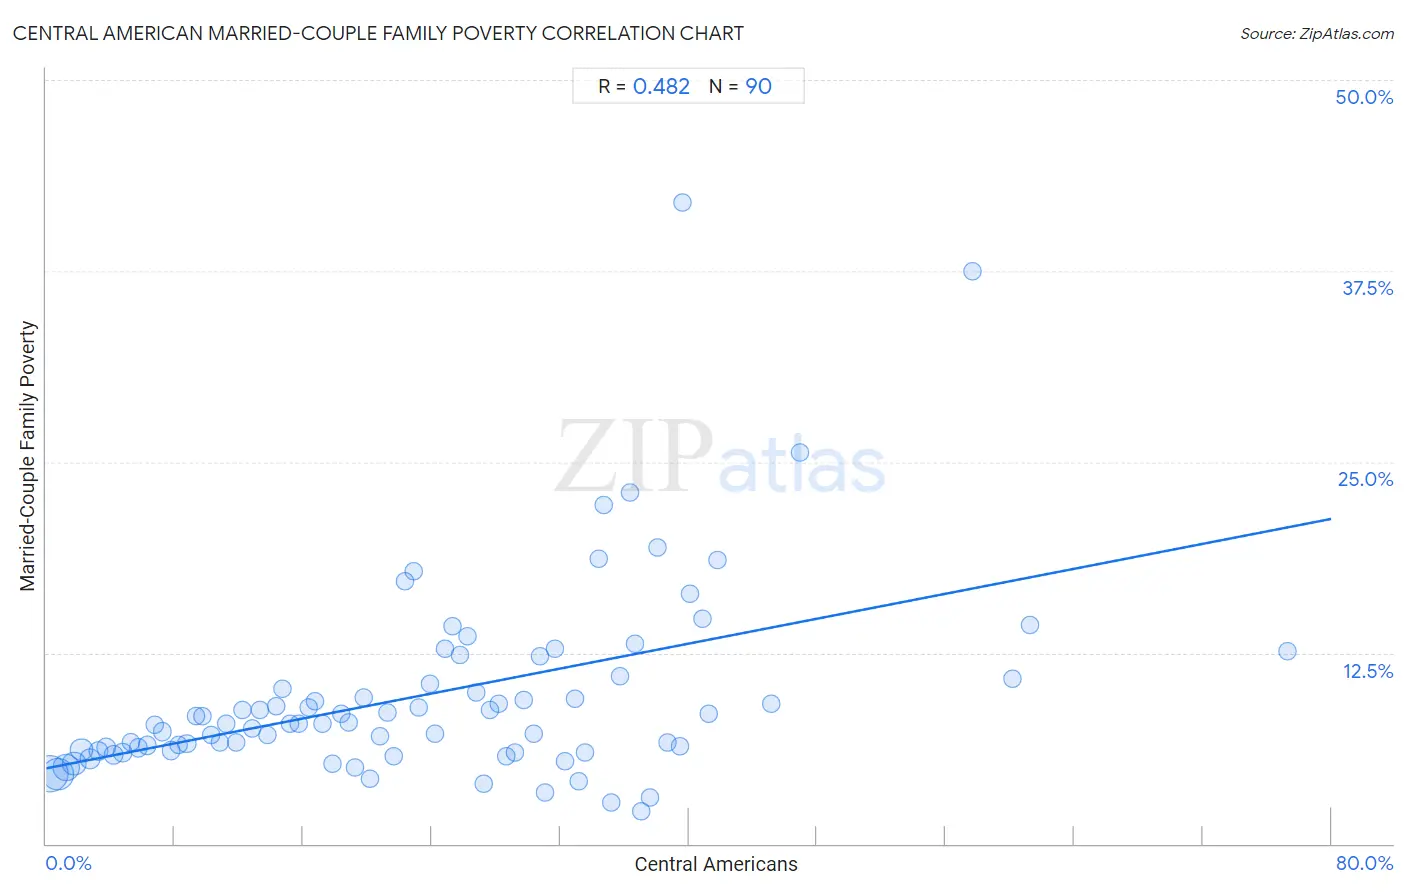
It is essential to understand that the correlation between the percentage of Central Americans and poverty level among married-couple families does not imply a direct cause-and-effect relationship. It remains uncertain whether the presence of Central Americans influences an upward or downward trend in the level of poverty level among married-couple families within an area, or if Central Americans simply ended up residing in those areas with higher or lower levels of poverty level among married-couple families due to other factors.
Demographics Similar to Central Americans by Married-Couple Family Poverty
In terms of married-couple family poverty, the demographic groups most similar to Central Americans are Immigrants from Ecuador (6.7%, a difference of 0.14%), Immigrants from El Salvador (6.8%, a difference of 0.42%), Immigrants from Belize (6.7%, a difference of 0.60%), Nicaraguan (6.7%, a difference of 0.75%), and Cuban (6.8%, a difference of 0.86%).
| Demographics | Rating | Rank | Married-Couple Family Poverty |
| Bahamians | 0.0 /100 | #294 | Tragic 6.6% |
| Immigrants from Uzbekistan | 0.0 /100 | #295 | Tragic 6.6% |
| U.S. Virgin Islanders | 0.0 /100 | #296 | Tragic 6.6% |
| Kiowa | 0.0 /100 | #297 | Tragic 6.6% |
| Immigrants from Guyana | 0.0 /100 | #298 | Tragic 6.7% |
| Nicaraguans | 0.0 /100 | #299 | Tragic 6.7% |
| Immigrants from Belize | 0.0 /100 | #300 | Tragic 6.7% |
| Central Americans | 0.0 /100 | #301 | Tragic 6.7% |
| Immigrants from Ecuador | 0.0 /100 | #302 | Tragic 6.7% |
| Immigrants from El Salvador | 0.0 /100 | #303 | Tragic 6.8% |
| Cubans | 0.0 /100 | #304 | Tragic 6.8% |
| Haitians | 0.0 /100 | #305 | Tragic 6.8% |
| Immigrants from Haiti | 0.0 /100 | #306 | Tragic 7.0% |
| Guatemalans | 0.0 /100 | #307 | Tragic 7.0% |
| Spanish American Indians | 0.0 /100 | #308 | Tragic 7.1% |
Central American Married-Couple Family Poverty Correlation Summary
| Measurement | Central American Data | Married-Couple Family Poverty Data |
| Minimum | 0.24% | 2.1% |
| Maximum | 77.3% | 41.9% |
| Range | 77.1% | 39.8% |
| Mean | 23.5% | 9.7% |
| Median | 22.6% | 7.9% |
| Interquartile 25% (IQ1) | 11.2% | 6.1% |
| Interquartile 75% (IQ3) | 33.6% | 10.8% |
| Interquartile Range (IQR) | 22.3% | 4.7% |
| Standard Deviation (Sample) | 15.2% | 6.5% |
| Standard Deviation (Population) | 15.2% | 6.4% |
Correlation Details
| Central American Percentile | Sample Size | Married-Couple Family Poverty |
[ 0.0% - 0.5% ] 0.24% | 143,302,468 | 4.6% |
[ 0.5% - 1.0% ] 0.74% | 98,784,941 | 4.5% |
[ 1.0% - 1.5% ] 1.24% | 67,044,101 | 5.0% |
[ 1.5% - 2.0% ] 1.74% | 40,519,163 | 5.3% |
[ 2.0% - 2.5% ] 2.21% | 34,216,428 | 6.2% |
[ 2.5% - 3.0% ] 2.75% | 17,793,850 | 5.5% |
[ 3.0% - 3.5% ] 3.25% | 13,316,657 | 6.1% |
[ 3.5% - 4.0% ] 3.74% | 10,800,159 | 6.3% |
[ 4.0% - 4.5% ] 4.20% | 11,845,083 | 5.8% |
[ 4.5% - 5.0% ] 4.77% | 7,765,895 | 5.9% |
[ 5.0% - 5.5% ] 5.26% | 5,320,610 | 6.7% |
[ 5.5% - 6.0% ] 5.74% | 5,764,756 | 6.3% |
[ 6.0% - 6.5% ] 6.27% | 3,628,792 | 6.4% |
[ 6.5% - 7.0% ] 6.76% | 3,836,790 | 7.8% |
[ 7.0% - 7.5% ] 7.25% | 2,729,062 | 7.3% |
[ 7.5% - 8.0% ] 7.76% | 1,865,281 | 6.1% |
[ 8.0% - 8.5% ] 8.21% | 2,065,229 | 6.5% |
[ 8.5% - 9.0% ] 8.74% | 1,781,356 | 6.6% |
[ 9.0% - 9.5% ] 9.33% | 3,967,028 | 8.4% |
[ 9.5% - 10.0% ] 9.73% | 1,140,959 | 8.3% |
[ 10.0% - 10.5% ] 10.29% | 934,267 | 7.1% |
[ 10.5% - 11.0% ] 10.78% | 1,215,656 | 6.7% |
[ 11.0% - 11.5% ] 11.23% | 793,219 | 7.9% |
[ 11.5% - 12.0% ] 11.80% | 1,074,862 | 6.7% |
[ 12.0% - 12.5% ] 12.24% | 643,733 | 8.8% |
[ 12.5% - 13.0% ] 12.84% | 4,749,886 | 7.6% |
[ 13.0% - 13.5% ] 13.27% | 800,117 | 8.8% |
[ 13.5% - 14.0% ] 13.79% | 818,455 | 7.1% |
[ 14.0% - 14.5% ] 14.31% | 861,741 | 9.0% |
[ 14.5% - 15.0% ] 14.73% | 439,748 | 10.2% |
[ 15.0% - 15.5% ] 15.17% | 399,220 | 7.9% |
[ 15.5% - 16.0% ] 15.72% | 439,972 | 7.9% |
[ 16.0% - 16.5% ] 16.33% | 819,867 | 8.9% |
[ 16.5% - 17.0% ] 16.74% | 535,652 | 9.3% |
[ 17.0% - 17.5% ] 17.16% | 384,954 | 7.8% |
[ 17.5% - 18.0% ] 17.84% | 296,791 | 5.2% |
[ 18.0% - 18.5% ] 18.37% | 53,802 | 8.5% |
[ 18.5% - 19.0% ] 18.84% | 666,418 | 8.0% |
[ 19.0% - 19.5% ] 19.23% | 108,705 | 5.0% |
[ 19.5% - 20.0% ] 19.77% | 239,585 | 9.6% |
[ 20.0% - 20.5% ] 20.14% | 206,480 | 4.2% |
[ 20.5% - 21.0% ] 20.76% | 170,564 | 7.0% |
[ 21.0% - 21.5% ] 21.27% | 247,298 | 8.6% |
[ 21.5% - 22.0% ] 21.63% | 107,458 | 5.8% |
[ 22.0% - 22.5% ] 22.31% | 74,575 | 17.2% |
[ 22.5% - 23.0% ] 22.87% | 187,299 | 17.8% |
[ 23.0% - 23.5% ] 23.19% | 141,030 | 8.9% |
[ 23.5% - 24.0% ] 23.86% | 12,949 | 10.4% |
[ 24.0% - 24.5% ] 24.18% | 183,709 | 7.2% |
[ 24.5% - 25.0% ] 24.80% | 179,185 | 12.7% |
[ 25.0% - 25.5% ] 25.27% | 119,504 | 14.2% |
[ 25.5% - 26.0% ] 25.77% | 250,936 | 12.4% |
[ 26.0% - 26.5% ] 26.24% | 221,590 | 13.6% |
[ 26.5% - 27.0% ] 26.79% | 257,681 | 9.9% |
[ 27.0% - 27.5% ] 27.27% | 16,364 | 4.0% |
[ 27.5% - 28.0% ] 27.62% | 152,945 | 8.8% |
[ 28.0% - 28.5% ] 28.21% | 47,274 | 9.2% |
[ 28.5% - 29.0% ] 28.67% | 56,405 | 5.8% |
[ 29.0% - 29.5% ] 29.17% | 107,395 | 6.0% |
[ 29.5% - 30.0% ] 29.76% | 115,067 | 9.4% |
[ 30.0% - 30.5% ] 30.32% | 123,662 | 7.2% |
[ 30.5% - 31.0% ] 30.77% | 207,899 | 12.3% |
[ 31.0% - 31.5% ] 31.04% | 97,556 | 3.4% |
[ 31.5% - 32.0% ] 31.64% | 62,846 | 12.7% |
[ 32.0% - 32.5% ] 32.31% | 132,315 | 5.4% |
[ 32.5% - 33.0% ] 32.90% | 24,660 | 9.5% |
[ 33.0% - 33.5% ] 33.16% | 75,940 | 4.1% |
[ 33.5% - 34.0% ] 33.56% | 33,122 | 6.0% |
[ 34.0% - 34.5% ] 34.38% | 10,639 | 18.6% |
[ 34.5% - 35.0% ] 34.73% | 59,607 | 22.2% |
[ 35.0% - 35.5% ] 35.20% | 9,444 | 2.7% |
[ 35.5% - 36.0% ] 35.69% | 33,018 | 11.0% |
[ 36.0% - 36.5% ] 36.32% | 1,473 | 23.0% |
[ 36.5% - 37.0% ] 36.65% | 94,823 | 13.1% |
[ 37.0% - 37.5% ] 37.05% | 19,289 | 2.1% |
[ 37.5% - 38.0% ] 37.61% | 10,563 | 3.1% |
[ 38.0% - 38.5% ] 38.08% | 1,938 | 19.4% |
[ 38.5% - 39.0% ] 38.65% | 39,220 | 6.6% |
[ 39.0% - 39.5% ] 39.46% | 25,324 | 6.4% |
[ 39.5% - 40.0% ] 39.65% | 7,945 | 41.9% |
[ 40.0% - 40.5% ] 40.10% | 17,329 | 16.4% |
[ 40.5% - 41.0% ] 40.86% | 15,109 | 14.7% |
[ 41.0% - 41.5% ] 41.22% | 16,944 | 8.5% |
[ 41.5% - 42.0% ] 41.78% | 1,764 | 18.5% |
[ 45.0% - 45.5% ] 45.12% | 79,765 | 9.2% |
[ 46.5% - 47.0% ] 46.92% | 211 | 25.6% |
[ 57.5% - 58.0% ] 57.69% | 182 | 37.5% |
[ 60.0% - 60.5% ] 60.18% | 50,387 | 10.8% |
[ 61.0% - 61.5% ] 61.24% | 129 | 14.3% |
[ 77.0% - 77.5% ] 77.31% | 21,778 | 12.6% |