Central American Disability Age Under 5
COMPARE
Central American
Select to Compare
Disability Age Under 5
Central American Disability Age Under 5
1.2%
DISABILITY | AGE UNDER 5
89.7/ 100
METRIC RATING
126th/ 347
METRIC RANK
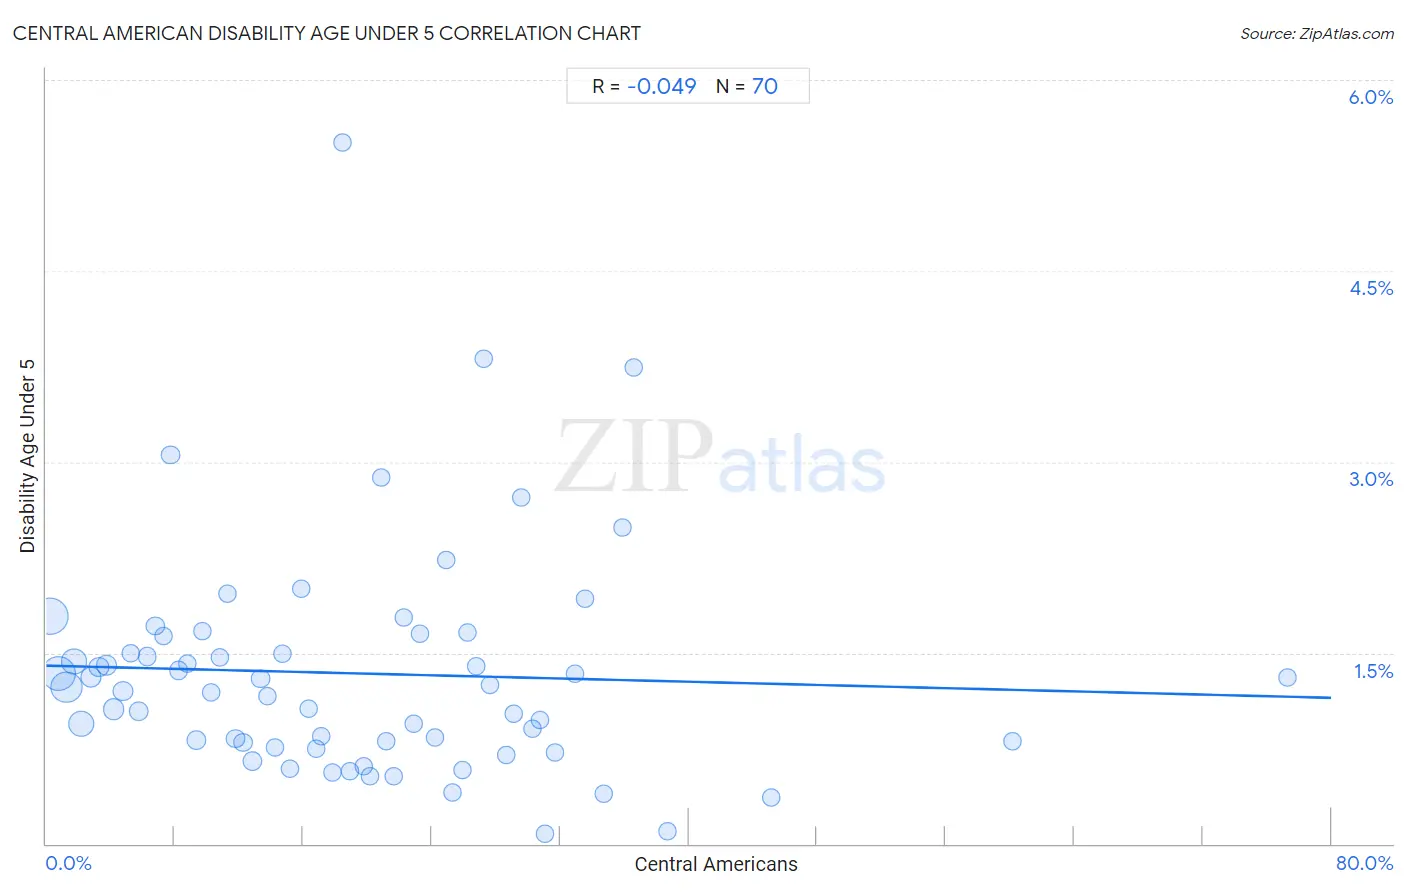
Central American Disability Age Under 5 Correlation Chart
The statistical analysis conducted on geographies consisting of 251,619,686 people shows no correlation between the proportion of Central Americans and percentage of population with a disability under the age of 5 in the United States with a correlation coefficient (R) of -0.049 and weighted average of 1.2%. On average, for every 1% (one percent) increase in Central Americans within a typical geography, there is a decrease of 0.0032% in percentage of population with a disability under the age of 5.
It is essential to understand that the correlation between the percentage of Central Americans and percentage of population with a disability under the age of 5 does not imply a direct cause-and-effect relationship. It remains uncertain whether the presence of Central Americans influences an upward or downward trend in the level of percentage of population with a disability under the age of 5 within an area, or if Central Americans simply ended up residing in those areas with higher or lower levels of percentage of population with a disability under the age of 5 due to other factors.
Demographics Similar to Central Americans by Disability Age Under 5
In terms of disability age under 5, the demographic groups most similar to Central Americans are Japanese (1.2%, a difference of 0.16%), Immigrants from Cambodia (1.2%, a difference of 0.22%), Zimbabwean (1.2%, a difference of 0.25%), Aleut (1.2%, a difference of 0.29%), and Immigrants from Romania (1.2%, a difference of 0.30%).
| Demographics | Rating | Rank | Disability Age Under 5 |
| Bhutanese | 92.5 /100 | #119 | Exceptional 1.2% |
| Immigrants from Eritrea | 92.3 /100 | #120 | Exceptional 1.2% |
| Immigrants from Senegal | 91.4 /100 | #121 | Exceptional 1.2% |
| Aleuts | 90.7 /100 | #122 | Exceptional 1.2% |
| Zimbabweans | 90.6 /100 | #123 | Exceptional 1.2% |
| Immigrants from Cambodia | 90.5 /100 | #124 | Exceptional 1.2% |
| Japanese | 90.3 /100 | #125 | Exceptional 1.2% |
| Central Americans | 89.7 /100 | #126 | Excellent 1.2% |
| Immigrants from Romania | 88.4 /100 | #127 | Excellent 1.2% |
| Immigrants from France | 88.4 /100 | #128 | Excellent 1.2% |
| Immigrants | 88.0 /100 | #129 | Excellent 1.2% |
| Koreans | 87.7 /100 | #130 | Excellent 1.2% |
| Immigrants from Serbia | 87.6 /100 | #131 | Excellent 1.2% |
| Immigrants from Eastern Europe | 87.3 /100 | #132 | Excellent 1.2% |
| Immigrants from Spain | 86.5 /100 | #133 | Excellent 1.2% |
Central American Disability Age Under 5 Correlation Summary
| Measurement | Central American Data | Disability Age Under 5 Data |
| Minimum | 0.25% | 0.078% |
| Maximum | 77.3% | 5.5% |
| Range | 77.1% | 5.4% |
| Mean | 19.3% | 1.3% |
| Median | 17.5% | 1.2% |
| Interquartile 25% (IQ1) | 8.8% | 0.79% |
| Interquartile 75% (IQ3) | 27.3% | 1.6% |
| Interquartile Range (IQR) | 18.5% | 0.84% |
| Standard Deviation (Sample) | 13.9% | 0.90% |
| Standard Deviation (Population) | 13.8% | 0.89% |
Correlation Details
| Central American Percentile | Sample Size | Disability Age Under 5 |
[ 0.0% - 0.5% ] 0.25% | 55,600,984 | 1.8% |
[ 0.5% - 1.0% ] 0.74% | 49,470,091 | 1.3% |
[ 1.0% - 1.5% ] 1.25% | 39,156,067 | 1.2% |
[ 1.5% - 2.0% ] 1.74% | 20,595,414 | 1.4% |
[ 2.0% - 2.5% ] 2.21% | 22,268,309 | 0.94% |
[ 2.5% - 3.0% ] 2.77% | 9,432,385 | 1.3% |
[ 3.0% - 3.5% ] 3.26% | 6,261,258 | 1.4% |
[ 3.5% - 4.0% ] 3.74% | 6,087,037 | 1.4% |
[ 4.0% - 4.5% ] 4.17% | 8,041,458 | 1.1% |
[ 4.5% - 5.0% ] 4.78% | 4,463,881 | 1.2% |
[ 5.0% - 5.5% ] 5.26% | 2,915,753 | 1.5% |
[ 5.5% - 6.0% ] 5.72% | 3,674,238 | 1.0% |
[ 6.0% - 6.5% ] 6.27% | 1,843,547 | 1.5% |
[ 6.5% - 7.0% ] 6.77% | 1,912,081 | 1.7% |
[ 7.0% - 7.5% ] 7.28% | 1,433,072 | 1.6% |
[ 7.5% - 8.0% ] 7.74% | 493,598 | 3.1% |
[ 8.0% - 8.5% ] 8.24% | 1,095,470 | 1.4% |
[ 8.5% - 9.0% ] 8.76% | 951,665 | 1.4% |
[ 9.0% - 9.5% ] 9.35% | 2,984,502 | 0.82% |
[ 9.5% - 10.0% ] 9.73% | 535,381 | 1.7% |
[ 10.0% - 10.5% ] 10.26% | 592,584 | 1.2% |
[ 10.5% - 11.0% ] 10.81% | 624,200 | 1.5% |
[ 11.0% - 11.5% ] 11.25% | 337,074 | 2.0% |
[ 11.5% - 12.0% ] 11.78% | 627,654 | 0.82% |
[ 12.0% - 12.5% ] 12.26% | 318,924 | 0.79% |
[ 12.5% - 13.0% ] 12.85% | 4,418,507 | 0.65% |
[ 13.0% - 13.5% ] 13.35% | 336,771 | 1.3% |
[ 13.5% - 14.0% ] 13.75% | 508,246 | 1.2% |
[ 14.0% - 14.5% ] 14.26% | 194,062 | 0.76% |
[ 14.5% - 15.0% ] 14.72% | 200,136 | 1.5% |
[ 15.0% - 15.5% ] 15.17% | 217,548 | 0.59% |
[ 15.5% - 16.0% ] 15.87% | 85,676 | 2.0% |
[ 16.0% - 16.5% ] 16.35% | 619,114 | 1.1% |
[ 16.5% - 17.0% ] 16.81% | 271,439 | 0.75% |
[ 17.0% - 17.5% ] 17.13% | 181,401 | 0.85% |
[ 17.5% - 18.0% ] 17.79% | 148,630 | 0.56% |
[ 18.0% - 18.5% ] 18.46% | 3,055 | 5.5% |
[ 18.5% - 19.0% ] 18.90% | 333,495 | 0.57% |
[ 19.5% - 20.0% ] 19.74% | 94,398 | 0.61% |
[ 20.0% - 20.5% ] 20.13% | 150,816 | 0.54% |
[ 20.5% - 21.0% ] 20.85% | 33,703 | 2.9% |
[ 21.0% - 21.5% ] 21.14% | 111,682 | 0.80% |
[ 21.5% - 22.0% ] 21.64% | 71,560 | 0.53% |
[ 22.0% - 22.5% ] 22.26% | 59,084 | 1.8% |
[ 22.5% - 23.0% ] 22.85% | 150,340 | 0.95% |
[ 23.0% - 23.5% ] 23.25% | 77,179 | 1.6% |
[ 24.0% - 24.5% ] 24.20% | 92,584 | 0.83% |
[ 24.5% - 25.0% ] 24.88% | 66,237 | 2.2% |
[ 25.0% - 25.5% ] 25.30% | 98,990 | 0.40% |
[ 25.5% - 26.0% ] 25.91% | 60,081 | 0.58% |
[ 26.0% - 26.5% ] 26.23% | 114,572 | 1.7% |
[ 26.5% - 27.0% ] 26.74% | 160,723 | 1.4% |
[ 27.0% - 27.5% ] 27.25% | 14,849 | 3.8% |
[ 27.5% - 28.0% ] 27.62% | 151,983 | 1.2% |
[ 28.5% - 29.0% ] 28.65% | 34,625 | 0.70% |
[ 29.0% - 29.5% ] 29.10% | 60,668 | 1.0% |
[ 29.5% - 30.0% ] 29.59% | 67,184 | 2.7% |
[ 30.0% - 30.5% ] 30.29% | 77,382 | 0.90% |
[ 30.5% - 31.0% ] 30.76% | 176,950 | 0.97% |
[ 31.0% - 31.5% ] 31.05% | 44,781 | 0.078% |
[ 31.5% - 32.0% ] 31.65% | 56,628 | 0.72% |
[ 32.5% - 33.0% ] 32.90% | 22,966 | 1.3% |
[ 33.5% - 34.0% ] 33.54% | 29,271 | 1.9% |
[ 34.5% - 35.0% ] 34.73% | 59,607 | 0.39% |
[ 35.5% - 36.0% ] 35.89% | 11,156 | 2.5% |
[ 36.5% - 37.0% ] 36.59% | 47,142 | 3.7% |
[ 38.5% - 39.0% ] 38.65% | 35,908 | 0.10% |
[ 45.0% - 45.5% ] 45.12% | 79,765 | 0.36% |
[ 60.0% - 60.5% ] 60.18% | 50,387 | 0.81% |
[ 77.0% - 77.5% ] 77.31% | 21,778 | 1.3% |