Pueblo Receiving Food Stamps
COMPARE
Pueblo
Select to Compare
Receiving Food Stamps
Pueblo Receiving Food Stamps
19.9%
PUBLIC INCOME | FOOD STAMPS
0.0/ 100
METRIC RATING
332nd/ 347
METRIC RANK
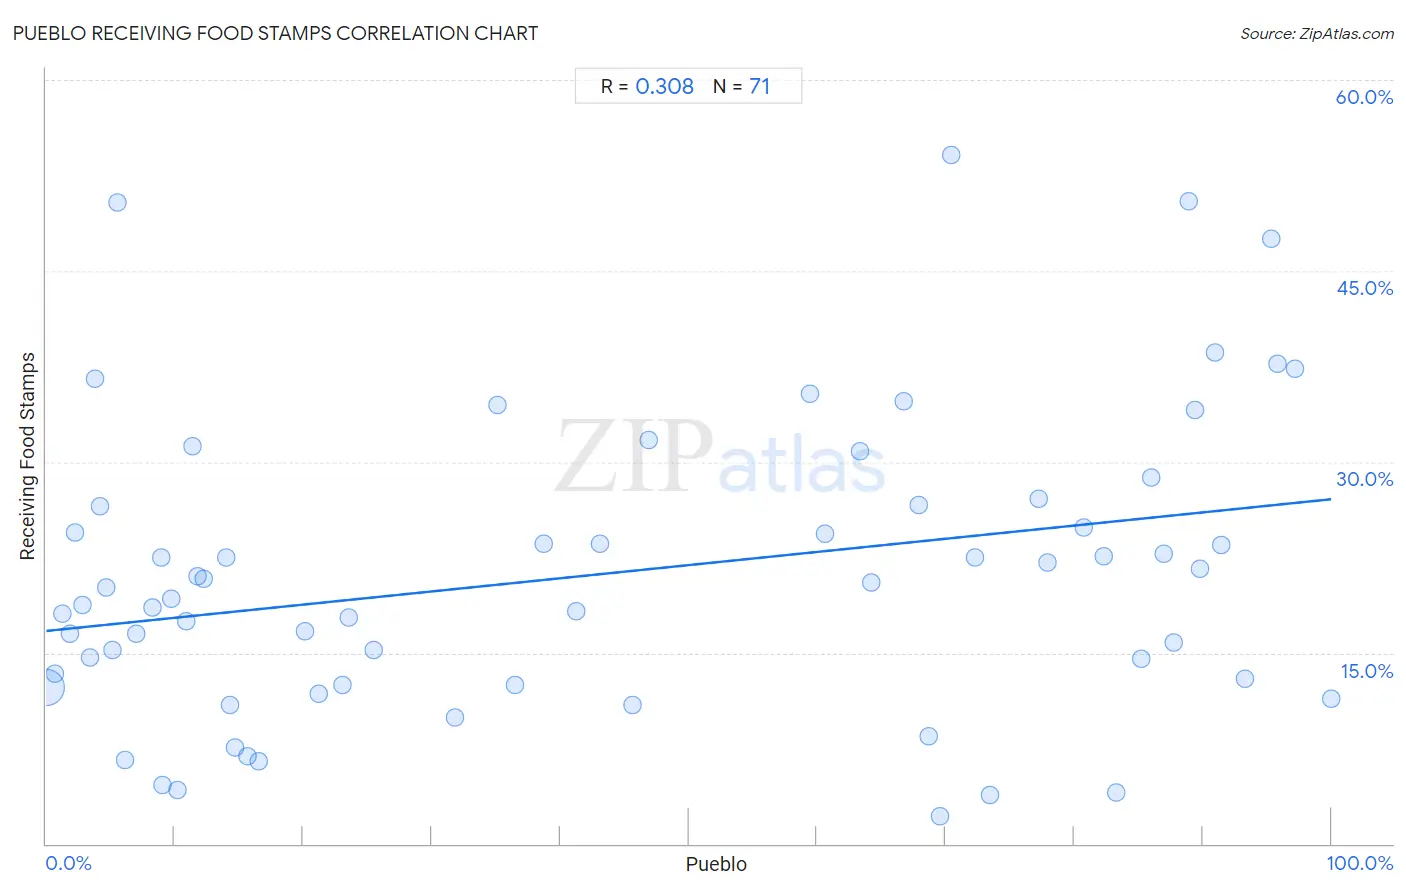
Pueblo Receiving Food Stamps Correlation Chart
The statistical analysis conducted on geographies consisting of 120,026,955 people shows a mild positive correlation between the proportion of Pueblo and percentage of population receiving government assistance and/or food stamps in the United States with a correlation coefficient (R) of 0.308 and weighted average of 19.9%. On average, for every 1% (one percent) increase in Pueblo within a typical geography, there is an increase of 0.10% in percentage of population receiving government assistance and/or food stamps.
It is essential to understand that the correlation between the percentage of Pueblo and percentage of population receiving government assistance and/or food stamps does not imply a direct cause-and-effect relationship. It remains uncertain whether the presence of Pueblo influences an upward or downward trend in the level of percentage of population receiving government assistance and/or food stamps within an area, or if Pueblo simply ended up residing in those areas with higher or lower levels of percentage of population receiving government assistance and/or food stamps due to other factors.
Demographics Similar to Pueblo by Receiving Food Stamps
In terms of receiving food stamps, the demographic groups most similar to Pueblo are Inupiat (20.1%, a difference of 0.73%), Immigrants from Caribbean (19.6%, a difference of 1.5%), Yuman (20.2%, a difference of 1.6%), Immigrants from Cuba (20.8%, a difference of 4.6%), and Pima (19.0%, a difference of 5.0%).
| Demographics | Rating | Rank | Receiving Food Stamps |
| Immigrants from Haiti | 0.0 /100 | #325 | Tragic 18.2% |
| Cubans | 0.0 /100 | #326 | Tragic 18.2% |
| Apache | 0.0 /100 | #327 | Tragic 18.3% |
| Colville | 0.0 /100 | #328 | Tragic 18.3% |
| Immigrants from Dominica | 0.0 /100 | #329 | Tragic 18.4% |
| Pima | 0.0 /100 | #330 | Tragic 19.0% |
| Immigrants from Caribbean | 0.0 /100 | #331 | Tragic 19.6% |
| Pueblo | 0.0 /100 | #332 | Tragic 19.9% |
| Inupiat | 0.0 /100 | #333 | Tragic 20.1% |
| Yuman | 0.0 /100 | #334 | Tragic 20.2% |
| Immigrants from Cuba | 0.0 /100 | #335 | Tragic 20.8% |
| Navajo | 0.0 /100 | #336 | Tragic 21.1% |
| Cape Verdeans | 0.0 /100 | #337 | Tragic 21.1% |
| Dominicans | 0.0 /100 | #338 | Tragic 21.4% |
| Yakama | 0.0 /100 | #339 | Tragic 21.4% |
Pueblo Receiving Food Stamps Correlation Summary
| Measurement | Pueblo Data | Receiving Food Stamps Data |
| Minimum | 0.045% | 2.2% |
| Maximum | 100.0% | 54.1% |
| Range | 100.0% | 51.9% |
| Mean | 43.2% | 21.2% |
| Median | 36.4% | 20.2% |
| Interquartile 25% (IQ1) | 9.7% | 12.5% |
| Interquartile 75% (IQ3) | 78.0% | 26.6% |
| Interquartile Range (IQR) | 68.3% | 14.1% |
| Standard Deviation (Sample) | 34.7% | 11.7% |
| Standard Deviation (Population) | 34.5% | 11.6% |
Correlation Details
| Pueblo Percentile | Sample Size | Receiving Food Stamps |
[ 0.0% - 0.5% ] 0.045% | 116,640,569 | 12.3% |
[ 0.5% - 1.0% ] 0.68% | 1,450,855 | 13.3% |
[ 1.0% - 1.5% ] 1.28% | 1,221,592 | 18.1% |
[ 1.5% - 2.0% ] 1.81% | 266,384 | 16.5% |
[ 2.0% - 2.5% ] 2.20% | 30,550 | 24.5% |
[ 2.5% - 3.0% ] 2.85% | 100,000 | 18.8% |
[ 3.0% - 3.5% ] 3.38% | 7,357 | 14.7% |
[ 3.5% - 4.0% ] 3.77% | 11,232 | 36.5% |
[ 4.0% - 4.5% ] 4.18% | 120,437 | 26.5% |
[ 4.5% - 5.0% ] 4.64% | 11,534 | 20.2% |
[ 5.0% - 5.5% ] 5.20% | 7,505 | 15.2% |
[ 5.5% - 6.0% ] 5.53% | 1,646 | 50.4% |
[ 6.0% - 6.5% ] 6.10% | 2,902 | 6.6% |
[ 7.0% - 7.5% ] 7.00% | 20,354 | 16.5% |
[ 8.0% - 8.5% ] 8.25% | 388 | 18.6% |
[ 8.5% - 9.0% ] 8.91% | 18,479 | 22.5% |
[ 9.0% - 9.5% ] 9.00% | 422 | 4.6% |
[ 9.5% - 10.0% ] 9.69% | 1,063 | 19.2% |
[ 10.0% - 10.5% ] 10.17% | 423 | 4.2% |
[ 10.5% - 11.0% ] 10.91% | 1,549 | 17.4% |
[ 11.0% - 11.5% ] 11.40% | 1,790 | 31.2% |
[ 11.5% - 12.0% ] 11.81% | 237 | 21.0% |
[ 12.0% - 12.5% ] 12.24% | 776 | 20.9% |
[ 13.5% - 14.0% ] 13.97% | 11,614 | 22.5% |
[ 14.0% - 14.5% ] 14.30% | 3,894 | 10.9% |
[ 14.5% - 15.0% ] 14.72% | 15,895 | 7.6% |
[ 15.5% - 16.0% ] 15.69% | 1,472 | 6.9% |
[ 16.5% - 17.0% ] 16.52% | 932 | 6.5% |
[ 20.0% - 20.5% ] 20.14% | 422 | 16.7% |
[ 21.0% - 21.5% ] 21.20% | 2,165 | 11.8% |
[ 23.0% - 23.5% ] 23.03% | 2,336 | 12.5% |
[ 23.5% - 24.0% ] 23.58% | 971 | 17.8% |
[ 25.5% - 26.0% ] 25.52% | 5,675 | 15.2% |
[ 31.5% - 32.0% ] 31.81% | 591 | 9.9% |
[ 35.0% - 35.5% ] 35.16% | 219 | 34.5% |
[ 36.0% - 36.5% ] 36.43% | 516 | 12.5% |
[ 38.5% - 39.0% ] 38.72% | 3,817 | 23.6% |
[ 41.0% - 41.5% ] 41.23% | 2,906 | 18.3% |
[ 43.0% - 43.5% ] 43.06% | 922 | 23.6% |
[ 45.5% - 46.0% ] 45.60% | 728 | 10.9% |
[ 46.5% - 47.0% ] 46.84% | 459 | 31.7% |
[ 59.0% - 59.5% ] 59.41% | 340 | 35.4% |
[ 60.5% - 61.0% ] 60.63% | 1,270 | 24.4% |
[ 63.0% - 63.5% ] 63.32% | 2,841 | 30.8% |
[ 64.0% - 64.5% ] 64.25% | 3,393 | 20.5% |
[ 66.5% - 67.0% ] 66.75% | 2,021 | 34.8% |
[ 67.5% - 68.0% ] 67.86% | 1,422 | 26.6% |
[ 68.5% - 69.0% ] 68.70% | 722 | 8.4% |
[ 69.5% - 70.0% ] 69.51% | 515 | 2.2% |
[ 70.0% - 70.5% ] 70.40% | 125 | 54.1% |
[ 72.0% - 72.5% ] 72.28% | 1,349 | 22.5% |
[ 73.0% - 73.5% ] 73.48% | 230 | 3.8% |
[ 77.0% - 77.5% ] 77.26% | 5,520 | 27.1% |
[ 77.5% - 78.0% ] 77.96% | 481 | 22.1% |
[ 80.5% - 81.0% ] 80.72% | 1,006 | 24.8% |
[ 82.0% - 82.5% ] 82.27% | 1,173 | 22.6% |
[ 83.0% - 83.5% ] 83.30% | 886 | 4.0% |
[ 85.0% - 85.5% ] 85.19% | 574 | 14.5% |
[ 85.5% - 86.0% ] 85.97% | 1,283 | 28.8% |
[ 86.5% - 87.0% ] 86.99% | 1,430 | 22.8% |
[ 87.5% - 88.0% ] 87.77% | 229 | 15.8% |
[ 88.5% - 89.0% ] 88.93% | 1,824 | 50.5% |
[ 89.0% - 89.5% ] 89.37% | 2,070 | 34.1% |
[ 89.5% - 90.0% ] 89.82% | 1,877 | 21.6% |
[ 90.5% - 91.0% ] 90.94% | 1,743 | 38.6% |
[ 91.0% - 91.5% ] 91.45% | 620 | 23.5% |
[ 93.0% - 93.5% ] 93.33% | 75 | 13.0% |
[ 95.0% - 95.5% ] 95.35% | 2,324 | 47.5% |
[ 95.5% - 96.0% ] 95.79% | 9,033 | 37.7% |
[ 97.0% - 97.5% ] 97.20% | 6,789 | 37.3% |
[ 99.5% - 100.0% ] 100.00% | 212 | 11.4% |