Pueblo Married-Couple Family Poverty

COMPARE

Pueblo
Race
Ancestry
AfghanAfricanAlaska NativeAlaskan AthabascanAlbanianAleutAlsatianAmericanApacheArabArapahoArgentineanArmenianAssyrian/Chaldean/SyriacAustralianAustrianBahamianBangladeshiBarbadianBasqueBelgianBelizeanBermudanBhutaneseBlackfeetBolivianBrazilianBritishBritish West IndianBulgarianBurmeseCajunCambodianCanadianCape VerdeanCarpatho RusynCelticCentral AmericanCentral American IndianCherokeeCheyenneChickasawChileanChineseChippewaChoctawColombianColvilleComancheCosta RicanCreeCreekCroatianCrowCubanCypriotCzechCzechoslovakianDanishDelawareDominicanDutchDutch West IndianEastern EuropeanEcuadorianEgyptianEnglishEstonianEthiopianEuropeanFijianFilipinoFinnishFrenchFrench American IndianFrench CanadianGermanGerman RussianGhanaianGreekGuamanian/ChamorroGuatemalanGuyaneseHaitianHmongHonduranHopiHoumaHungarianIcelanderIndian (Asian)IndonesianInupiatIranianIraqiIrishIroquoisIsraeliItalianJamaicanJapaneseJordanianKenyanKiowaKoreanLaotianLatvianLebaneseLiberianLithuanianLumbeeLuxembourgerMacedonianMalaysianMalteseMarshalleseMenomineeMexicanMexican American IndianMongolianMoroccanNative HawaiianNavajoNepaleseNew ZealanderNicaraguanNigerianNorthern EuropeanNorwegianOkinawanOsageOttawaPaiutePakistaniPalestinianPanamanianParaguayanPennsylvania GermanPeruvianPimaPolishPortuguesePotawatomiPuebloPuerto RicanPuget Sound SalishRomanianRussianSalvadoranSamoanScandinavianScotch-IrishScottishSeminoleSenegaleseSerbianShoshoneSierra LeoneanSiouxSlavicSlovakSloveneSomaliSouth AfricanSouth AmericanSouth American IndianSoviet UnionSpaniardSpanishSpanish AmericanSpanish American IndianSri LankanSubsaharan AfricanSudaneseSwedishSwissSyrianTaiwaneseThaiTlingit-HaidaTohono O'OdhamTonganTrinidadian and TobagonianTsimshianTurkishU.S. Virgin IslanderUgandanUkrainianUruguayanUteVenezuelanVietnameseWelshWest IndianYakamaYaquiYugoslavianYumanYup'ikZimbabwean
Immigration
NonimmigrantsImmigrantsAfghanistanAfricaAlbaniaArgentinaArmeniaAsiaAustraliaAustriaBahamasBangladeshBarbadosBelarusBelgiumBelizeBoliviaBosnia and HerzegovinaBrazilBulgariaBurma/MyanmarCabo VerdeCambodiaCameroonCanadaCaribbeanCentral AmericaChileChinaColombiaCongoCosta RicaCroatiaCubaCzechoslovakiaDenmarkDominicaDominican RepublicEastern AfricaEastern AsiaEastern EuropeEcuadorEgyptEl SalvadorEnglandEritreaEthiopiaEuropeFijiFranceGermanyGhanaGreeceGrenadaGuatemalaGuyanaHaitiHondurasHong KongHungaryIndiaIndonesiaIranIraqIrelandIsraelItalyJamaicaJapanJordanKazakhstanKenyaKoreaKuwaitLaosLatin AmericaLatviaLebanonLiberiaLithuaniaMalaysiaMexicoMicronesiaMiddle AfricaMoldovaMoroccoNepalNetherlandsNicaraguaNigeriaNorth AmericaNorth MacedoniaNorthern AfricaNorthern EuropeNorwayOceaniaPakistanPanamaPeruPhilippinesPolandPortugalRomaniaRussiaSaudi ArabiaScotlandSenegalSerbiaSierra LeoneSingaporeSomaliaSouth AfricaSouth AmericaSouth Central AsiaSouth Eastern AsiaSouthern EuropeSpainSri LankaSt. Vincent and the GrenadinesSudanSwedenSwitzerlandSyriaTaiwanThailandTrinidad and TobagoTurkeyUgandaUkraineUruguayUzbekistanVenezuelaVietnamWest IndiesWestern AfricaWestern AsiaWestern EuropeYemenZaireZimbabweAzores
Select to Compare
Race
Ancestry
AfghanAfricanAlaska NativeAlaskan AthabascanAlbanianAleutAlsatianAmericanApacheArabArapahoArgentineanArmenianAssyrian/Chaldean/SyriacAustralianAustrianBahamianBangladeshiBarbadianBasqueBelgianBelizeanBermudanBhutaneseBlackfeetBolivianBrazilianBritishBritish West IndianBulgarianBurmeseCajunCambodianCanadianCape VerdeanCarpatho RusynCelticCentral AmericanCentral American IndianCherokeeCheyenneChickasawChileanChineseChippewaChoctawColombianColvilleComancheCosta RicanCreeCreekCroatianCrowCubanCypriotCzechCzechoslovakianDanishDelawareDominicanDutchDutch West IndianEastern EuropeanEcuadorianEgyptianEnglishEstonianEthiopianEuropeanFijianFilipinoFinnishFrenchFrench American IndianFrench CanadianGermanGerman RussianGhanaianGreekGuamanian/ChamorroGuatemalanGuyaneseHaitianHmongHonduranHopiHoumaHungarianIcelanderIndian (Asian)IndonesianInupiatIranianIraqiIrishIroquoisIsraeliItalianJamaicanJapaneseJordanianKenyanKiowaKoreanLaotianLatvianLebaneseLiberianLithuanianLumbeeLuxembourgerMacedonianMalaysianMalteseMarshalleseMenomineeMexicanMexican American IndianMongolianMoroccanNative HawaiianNavajoNepaleseNew ZealanderNicaraguanNigerianNorthern EuropeanNorwegianOkinawanOsageOttawaPaiutePakistaniPalestinianPanamanianParaguayanPennsylvania GermanPeruvianPimaPolishPortuguesePotawatomiPuerto RicanPuget Sound SalishRomanianRussianSalvadoranSamoanScandinavianScotch-IrishScottishSeminoleSenegaleseSerbianShoshoneSierra LeoneanSiouxSlavicSlovakSloveneSomaliSouth AfricanSouth AmericanSouth American IndianSoviet UnionSpaniardSpanishSpanish AmericanSpanish American IndianSri LankanSubsaharan AfricanSudaneseSwedishSwissSyrianTaiwaneseThaiTlingit-HaidaTohono O'OdhamTonganTrinidadian and TobagonianTsimshianTurkishU.S. Virgin IslanderUgandanUkrainianUruguayanUteVenezuelanVietnameseWelshWest IndianYakamaYaquiYugoslavianYumanYup'ikZimbabwean
Immigration
NonimmigrantsImmigrantsAfghanistanAfricaAlbaniaArgentinaArmeniaAsiaAustraliaAustriaBahamasBangladeshBarbadosBelarusBelgiumBelizeBoliviaBosnia and HerzegovinaBrazilBulgariaBurma/MyanmarCabo VerdeCambodiaCameroonCanadaCaribbeanCentral AmericaChileChinaColombiaCongoCosta RicaCroatiaCubaCzechoslovakiaDenmarkDominicaDominican RepublicEastern AfricaEastern AsiaEastern EuropeEcuadorEgyptEl SalvadorEnglandEritreaEthiopiaEuropeFijiFranceGermanyGhanaGreeceGrenadaGuatemalaGuyanaHaitiHondurasHong KongHungaryIndiaIndonesiaIranIraqIrelandIsraelItalyJamaicaJapanJordanKazakhstanKenyaKoreaKuwaitLaosLatin AmericaLatviaLebanonLiberiaLithuaniaMalaysiaMexicoMicronesiaMiddle AfricaMoldovaMoroccoNepalNetherlandsNicaraguaNigeriaNorth AmericaNorth MacedoniaNorthern AfricaNorthern EuropeNorwayOceaniaPakistanPanamaPeruPhilippinesPolandPortugalRomaniaRussiaSaudi ArabiaScotlandSenegalSerbiaSierra LeoneSingaporeSomaliaSouth AfricaSouth AmericaSouth Central AsiaSouth Eastern AsiaSouthern EuropeSpainSri LankaSt. Vincent and the GrenadinesSudanSwedenSwitzerlandSyriaTaiwanThailandTrinidad and TobagoTurkeyUgandaUkraineUruguayUzbekistanVenezuelaVietnamWest IndiesWestern AfricaWestern AsiaWestern EuropeYemenZaireZimbabweAzores
Married-Couple Family Poverty
Income
Poverty
Unemployment
Labor Participation
Family Structure
Vehicle Availability
Education Level
Disability

Pueblo Married-Couple Family Poverty
Tragic

11.1%
POVERTY | MARRIED-COUPLE FAMILIES
0.0/ 100
METRIC RATING
341st/ 347
METRIC RANK

Pueblo Married-Couple Family Poverty Correlation Chart

The statistical analysis conducted on geographies consisting of 119,779,377 people shows a mild positive correlation between the proportion of Pueblo and poverty level among married-couple families in the United States with a correlation coefficient (R) of 0.398 and weighted average of 11.1%. On average, for every 1% (one percent) increase in Pueblo within a typical geography, there is an increase of 0.27% in poverty level among married-couple families.
Pueblo Married-Couple Family Poverty
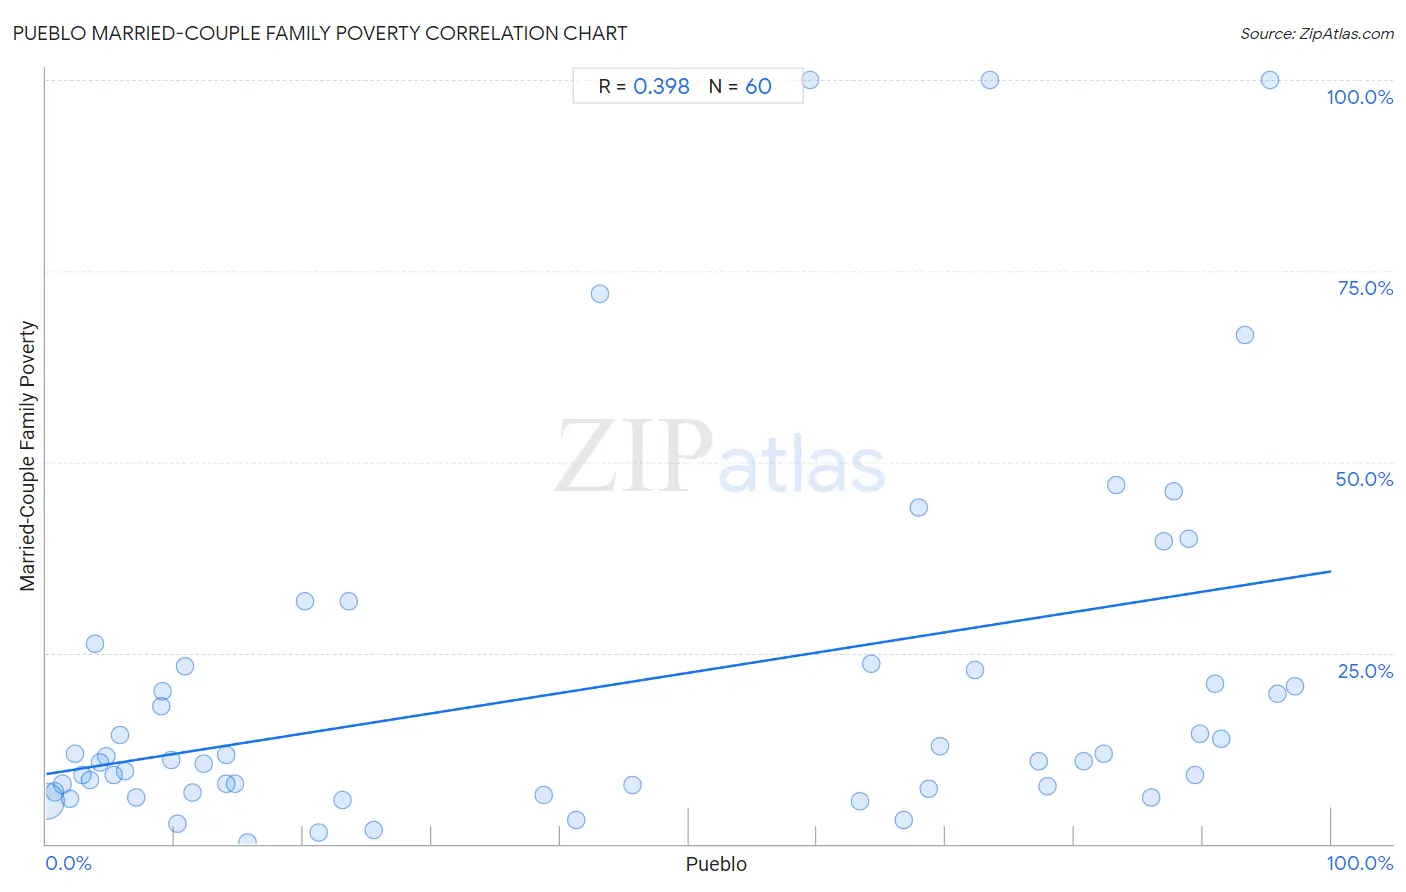
It is essential to understand that the correlation between the percentage of Pueblo and poverty level among married-couple families does not imply a direct cause-and-effect relationship. It remains uncertain whether the presence of Pueblo influences an upward or downward trend in the level of poverty level among married-couple families within an area, or if Pueblo simply ended up residing in those areas with higher or lower levels of poverty level among married-couple families due to other factors.

Demographics Similar to Pueblo by Married-Couple Family Poverty

In terms of married-couple family poverty, the demographic groups most similar to Pueblo are Tohono O'odham (11.2%, a difference of 0.93%), Pima (11.4%, a difference of 2.6%), Navajo (11.9%, a difference of 6.6%), Puerto Rican (12.6%, a difference of 13.7%), and Yuman (9.7%, a difference of 14.2%).
DemographicsRating | RankMarried-Couple Family Poverty
Lumbee
0.0
/100
|
#333
Tragic
8.3%
Immigrants from Dominican Republic
0.0
/100
|
#334
Tragic
8.4%
Sioux
0.0
/100
|
#335
Tragic
8.7%
Apache
0.0
/100
|
#336
Tragic
9.0%
Yakama
0.0
/100
|
#337
Tragic
9.0%
Cheyenne
0.0
/100
|
#338
Tragic
9.4%
Crow
0.0
/100
|
#339
Tragic
9.6%
Yuman
0.0
/100
|
#340
Tragic
9.7%
Pueblo
0.0
/100
|
#341
Tragic
11.1%
Tohono O'odham
0.0
/100
|
#342
Tragic
11.2%
Pima
0.0
/100
|
#343
Tragic
11.4%
Navajo
0.0
/100
|
#344
Tragic
11.9%
Puerto Ricans
0.0
/100
|
#345
Tragic
12.6%
Immigrants from Yemen
0.0
/100
|
#346
Tragic
12.8%
Yup'ik
0.0
/100
|
#347
Tragic
13.4%

Pueblo Married-Couple Family Poverty Correlation Summary

MeasurementPueblo DataMarried-Couple Family Poverty Data
Minimum0.045%0.23%
Maximum97.2%100.0%
Range97.2%99.8%
Mean42.7%20.5%
Median32.1%10.9%
Interquartile 25% (IQ1)9.0%7.0%
Interquartile 75% (IQ3)79.3%23.0%
Interquartile Range (IQR)70.4%16.0%
Standard Deviation (Sample)35.7%23.7%
Standard Deviation (Population)35.4%23.5%

Correlation Details

Pueblo PercentileSample SizeMarried-Couple Family Poverty
[
0.0%
-
0.5%
]
0.045%
116,476,4655.6%
[
0.5%
-
1.0%
]
0.68%
1,408,7336.8%
[
1.0%
-
1.5%
]
1.28%
1,213,4607.8%
[
1.5%
-
2.0%
]
1.82%
257,8815.9%
[
2.0%
-
2.5%
]
2.20%
26,49711.8%
[
2.5%
-
3.0%
]
2.85%
99,1099.0%
[
3.0%
-
3.5%
]
3.39%
5,8998.4%
[
3.5%
-
4.0%
]
3.77%
10,80526.2%
[
4.0%
-
4.5%
]
4.18%
117,49510.6%
[
4.5%
-
5.0%
]
4.64%
11,53411.5%
[
5.0%
-
5.5%
]
5.21%
5,5718.9%
[
5.5%
-
6.0%
]
5.73%
19214.3%
[
6.0%
-
6.5%
]
6.10%
2,9029.4%
[
7.0%
-
7.5%
]
7.00%
20,3546.1%
[
8.5%
-
9.0%
]
8.91%
18,47918.0%
[
9.0%
-
9.5%
]
9.00%
42220.0%
[
9.5%
-
10.0%
]
9.69%
1,06311.0%
[
10.0%
-
10.5%
]
10.17%
4232.6%
[
10.5%
-
11.0%
]
10.84%
48923.3%
[
11.0%
-
11.5%
]
11.40%
1,5526.6%
[
12.0%
-
12.5%
]
12.25%
54710.5%
[
13.5%
-
14.0%
]
13.97%
11,6147.9%
[
14.0%
-
14.5%
]
14.02%
1,58311.7%
[
14.5%
-
15.0%
]
14.72%
15,8957.8%
[
15.5%
-
16.0%
]
15.69%
1,4720.23%
[
20.0%
-
20.5%
]
20.14%
42231.7%
[
21.0%
-
21.5%
]
21.20%
2,1651.5%
[
23.0%
-
23.5%
]
23.03%
2,3365.7%
[
23.5%
-
24.0%
]
23.55%
36131.7%
[
25.5%
-
26.0%
]
25.50%
5,4501.8%
[
38.5%
-
39.0%
]
38.72%
3,8176.4%
[
41.0%
-
41.5%
]
41.23%
2,9063.1%
[
43.0%
-
43.5%
]
43.06%
92272.0%
[
45.5%
-
46.0%
]
45.60%
7287.7%
[
59.0%
-
59.5%
]
59.41%
340100.0%
[
63.0%
-
63.5%
]
63.32%
2,8415.5%
[
64.0%
-
64.5%
]
64.25%
3,39323.5%
[
66.5%
-
67.0%
]
66.75%
2,0213.2%
[
67.5%
-
68.0%
]
67.86%
1,42244.0%
[
68.5%
-
69.0%
]
68.70%
7227.1%
[
69.5%
-
70.0%
]
69.51%
51512.7%
[
72.0%
-
72.5%
]
72.28%
1,34922.8%
[
73.0%
-
73.5%
]
73.48%
230100.0%
[
77.0%
-
77.5%
]
77.26%
5,52010.8%
[
77.5%
-
78.0%
]
77.96%
4817.5%
[
80.5%
-
81.0%
]
80.72%
1,00610.8%
[
82.0%
-
82.5%
]
82.27%
1,17311.9%
[
83.0%
-
83.5%
]
83.30%
88647.0%
[
85.5%
-
86.0%
]
85.97%
1,2836.0%
[
86.5%
-
87.0%
]
86.99%
1,43039.6%
[
87.5%
-
88.0%
]
87.77%
22946.2%
[
88.5%
-
89.0%
]
88.93%
1,82440.0%
[
89.0%
-
89.5%
]
89.37%
2,0709.0%
[
89.5%
-
90.0%
]
89.82%
1,87714.4%
[
90.5%
-
91.0%
]
90.94%
1,74321.0%
[
91.0%
-
91.5%
]
91.45%
62013.7%
[
93.0%
-
93.5%
]
93.33%
7566.7%
[
95.0%
-
95.5%
]
95.22%
962100.0%
[
95.5%
-
96.0%
]
95.79%
9,03319.7%
[
97.0%
-
97.5%
]
97.20%
6,78920.6%