Palestinian Unemployment Among Women with Children Ages 6 to 17 years
COMPARE
Palestinian
Select to Compare
Unemployment Among Women with Children Ages 6 to 17 years
Palestinian Unemployment Among Women with Children Ages 6 to 17 years
9.0%
UNEMPLOYMENT | WOMEN W/ CHILDREN 6 TO 17
33.4/ 100
METRIC RATING
184th/ 347
METRIC RANK
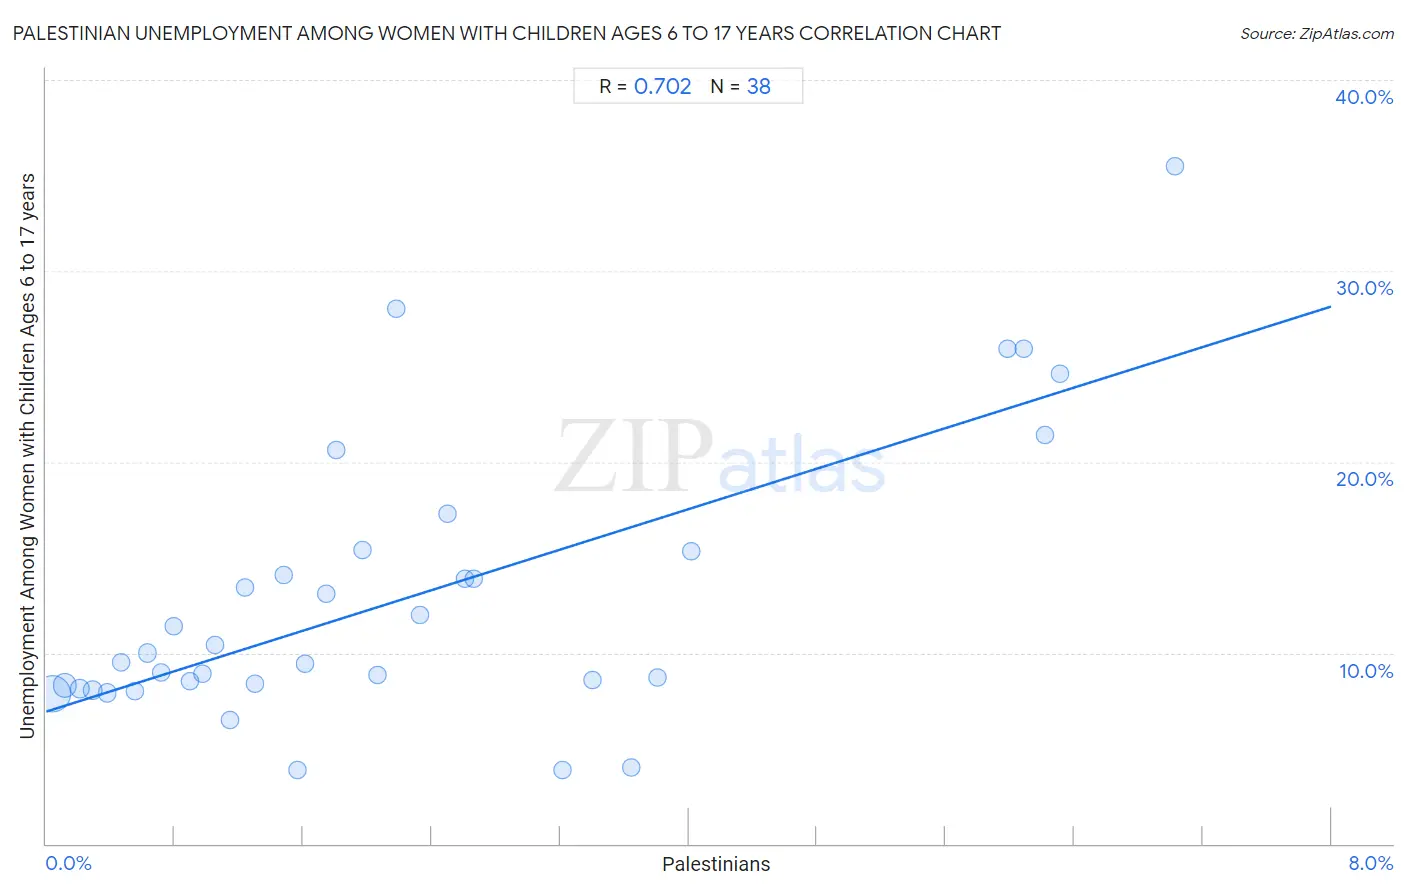
Palestinian Unemployment Among Women with Children Ages 6 to 17 years Correlation Chart
The statistical analysis conducted on geographies consisting of 174,381,840 people shows a strong positive correlation between the proportion of Palestinians and unemployment rate among women with children between the ages 6 and 17 in the United States with a correlation coefficient (R) of 0.702 and weighted average of 9.0%. On average, for every 1% (one percent) increase in Palestinians within a typical geography, there is an increase of 2.7% in unemployment rate among women with children between the ages 6 and 17.
It is essential to understand that the correlation between the percentage of Palestinians and unemployment rate among women with children between the ages 6 and 17 does not imply a direct cause-and-effect relationship. It remains uncertain whether the presence of Palestinians influences an upward or downward trend in the level of unemployment rate among women with children between the ages 6 and 17 within an area, or if Palestinians simply ended up residing in those areas with higher or lower levels of unemployment rate among women with children between the ages 6 and 17 due to other factors.
Demographics Similar to Palestinians by Unemployment Among Women with Children Ages 6 to 17 years
In terms of unemployment among women with children ages 6 to 17 years, the demographic groups most similar to Palestinians are Swiss (9.0%, a difference of 0.0%), Immigrants from Congo (9.0%, a difference of 0.040%), Immigrants from Czechoslovakia (9.0%, a difference of 0.050%), South American Indian (9.0%, a difference of 0.050%), and Immigrants from Spain (9.0%, a difference of 0.050%).
| Demographics | Rating | Rank | Unemployment Among Women with Children Ages 6 to 17 years |
| Immigrants from Jordan | 41.6 /100 | #177 | Average 9.0% |
| Menominee | 39.3 /100 | #178 | Fair 9.0% |
| Immigrants from Zaire | 38.3 /100 | #179 | Fair 9.0% |
| Ethiopians | 37.6 /100 | #180 | Fair 9.0% |
| Immigrants from Czechoslovakia | 34.5 /100 | #181 | Fair 9.0% |
| South American Indians | 34.4 /100 | #182 | Fair 9.0% |
| Swiss | 33.5 /100 | #183 | Fair 9.0% |
| Palestinians | 33.4 /100 | #184 | Fair 9.0% |
| Immigrants from Congo | 32.5 /100 | #185 | Fair 9.0% |
| Immigrants from Spain | 32.4 /100 | #186 | Fair 9.0% |
| Comanche | 30.0 /100 | #187 | Fair 9.0% |
| Immigrants from Syria | 29.7 /100 | #188 | Fair 9.1% |
| Immigrants | 29.2 /100 | #189 | Fair 9.1% |
| Slovenes | 28.5 /100 | #190 | Fair 9.1% |
| Belizeans | 28.4 /100 | #191 | Fair 9.1% |
Palestinian Unemployment Among Women with Children Ages 6 to 17 years Correlation Summary
| Measurement | Palestinian Data | Unemployment Among Women with Children Ages 6 to 17 years Data |
| Minimum | 0.037% | 3.8% |
| Maximum | 7.0% | 35.5% |
| Range | 7.0% | 31.7% |
| Mean | 2.2% | 12.9% |
| Median | 1.7% | 9.7% |
| Interquartile 25% (IQ1) | 0.79% | 8.3% |
| Interquartile 75% (IQ3) | 3.2% | 15.3% |
| Interquartile Range (IQR) | 2.4% | 7.0% |
| Standard Deviation (Sample) | 1.9% | 7.3% |
| Standard Deviation (Population) | 1.9% | 7.2% |
Correlation Details
| Palestinian Percentile | Sample Size | Unemployment Among Women with Children Ages 6 to 17 years |
[ 0.0% - 0.5% ] 0.037% | 115,329,229 | 7.8% |
[ 0.0% - 0.5% ] 0.12% | 33,147,310 | 8.3% |
[ 0.0% - 0.5% ] 0.21% | 9,074,293 | 8.1% |
[ 0.0% - 0.5% ] 0.29% | 5,598,368 | 8.0% |
[ 0.0% - 0.5% ] 0.38% | 3,368,386 | 7.9% |
[ 0.0% - 0.5% ] 0.47% | 1,866,611 | 9.5% |
[ 0.5% - 1.0% ] 0.55% | 1,161,300 | 8.0% |
[ 0.5% - 1.0% ] 0.63% | 983,091 | 10.0% |
[ 0.5% - 1.0% ] 0.71% | 856,255 | 9.0% |
[ 0.5% - 1.0% ] 0.79% | 300,018 | 11.4% |
[ 0.5% - 1.0% ] 0.90% | 657,857 | 8.5% |
[ 0.5% - 1.0% ] 0.97% | 304,987 | 8.9% |
[ 1.0% - 1.5% ] 1.05% | 256,093 | 10.4% |
[ 1.0% - 1.5% ] 1.14% | 199,378 | 6.5% |
[ 1.0% - 1.5% ] 1.24% | 131,548 | 13.4% |
[ 1.0% - 1.5% ] 1.30% | 222,340 | 8.4% |
[ 1.0% - 1.5% ] 1.48% | 44,366 | 14.1% |
[ 1.5% - 2.0% ] 1.56% | 157,311 | 3.8% |
[ 1.5% - 2.0% ] 1.61% | 48,749 | 9.4% |
[ 1.5% - 2.0% ] 1.74% | 34,350 | 13.1% |
[ 1.5% - 2.0% ] 1.81% | 63,426 | 20.6% |
[ 1.5% - 2.0% ] 1.97% | 57,728 | 15.4% |
[ 2.0% - 2.5% ] 2.06% | 100,871 | 8.8% |
[ 2.0% - 2.5% ] 2.18% | 29,870 | 28.0% |
[ 2.0% - 2.5% ] 2.33% | 36,543 | 12.0% |
[ 2.0% - 2.5% ] 2.50% | 71,023 | 17.3% |
[ 2.5% - 3.0% ] 2.61% | 11,084 | 13.9% |
[ 2.5% - 3.0% ] 2.66% | 10,859 | 13.9% |
[ 3.0% - 3.5% ] 3.21% | 68,870 | 3.9% |
[ 3.0% - 3.5% ] 3.40% | 36,556 | 8.6% |
[ 3.5% - 4.0% ] 3.64% | 40,942 | 4.0% |
[ 3.5% - 4.0% ] 3.81% | 4,018 | 8.7% |
[ 4.0% - 4.5% ] 4.01% | 10,912 | 15.3% |
[ 5.5% - 6.0% ] 5.98% | 14,915 | 25.9% |
[ 6.0% - 6.5% ] 6.09% | 14,650 | 25.9% |
[ 6.0% - 6.5% ] 6.22% | 45,772 | 21.4% |
[ 6.0% - 6.5% ] 6.31% | 16,939 | 24.6% |
[ 7.0% - 7.5% ] 7.03% | 5,022 | 35.5% |