Palestinian 1 or more Vehicles in Household
COMPARE
Palestinian
Select to Compare
1 or more Vehicles in Household
Palestinian 1 or more Vehicles in Household
91.7%
1+ VEHICLES AVAILABLE
99.7/ 100
METRIC RATING
69th/ 347
METRIC RANK
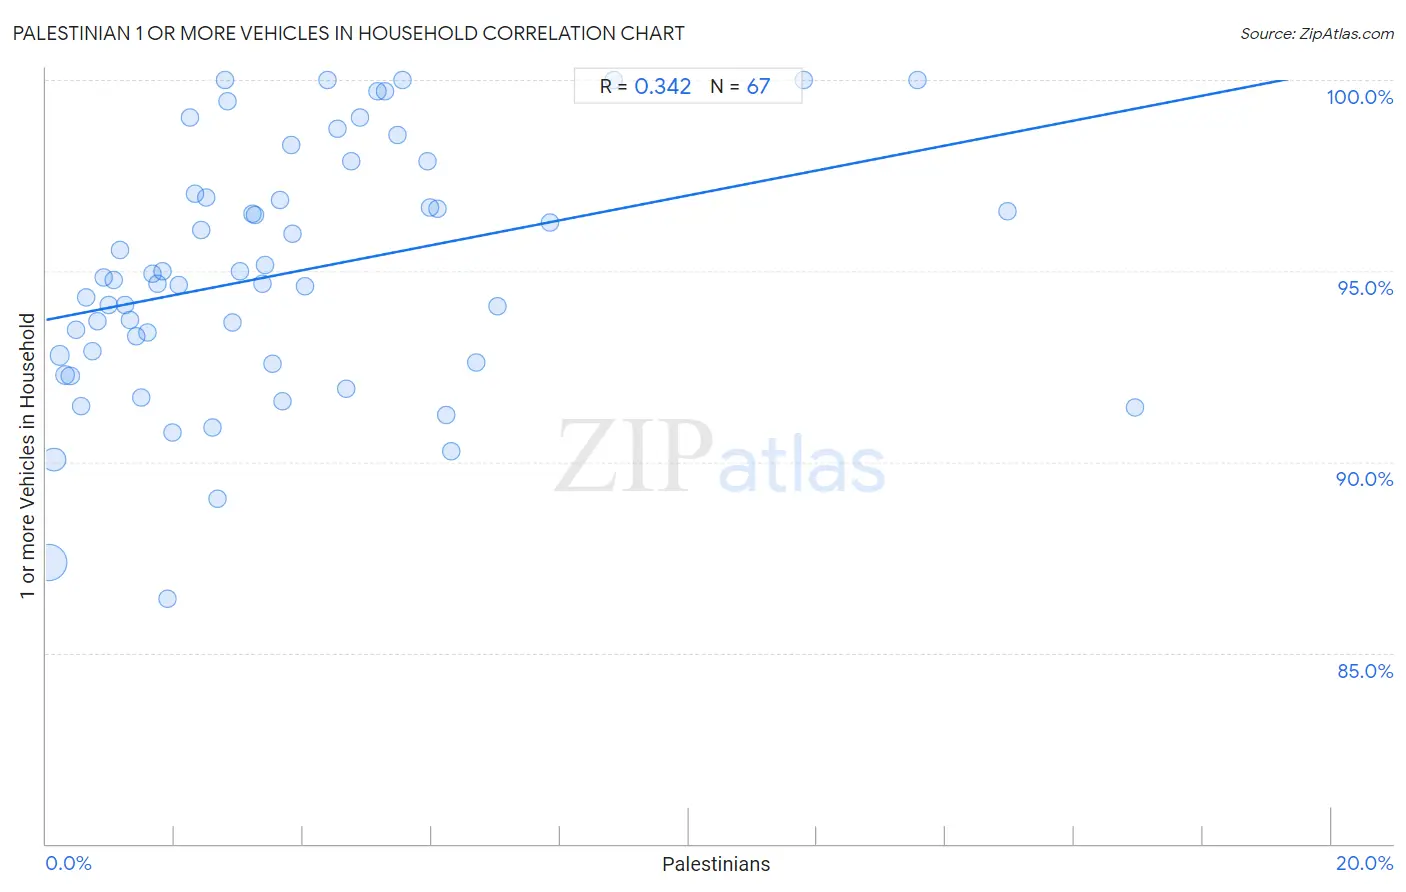
Palestinian 1 or more Vehicles in Household Correlation Chart
The statistical analysis conducted on geographies consisting of 216,371,451 people shows a mild positive correlation between the proportion of Palestinians and percentage of households with 1 or more vehicles available in the United States with a correlation coefficient (R) of 0.342 and weighted average of 91.7%. On average, for every 1% (one percent) increase in Palestinians within a typical geography, there is an increase of 0.33% in percentage of households with 1 or more vehicles available.
It is essential to understand that the correlation between the percentage of Palestinians and percentage of households with 1 or more vehicles available does not imply a direct cause-and-effect relationship. It remains uncertain whether the presence of Palestinians influences an upward or downward trend in the level of percentage of households with 1 or more vehicles available within an area, or if Palestinians simply ended up residing in those areas with higher or lower levels of percentage of households with 1 or more vehicles available due to other factors.
Demographics Similar to Palestinians by 1 or more Vehicles in Household
In terms of 1 or more vehicles in household, the demographic groups most similar to Palestinians are Lithuanian (91.7%, a difference of 0.020%), Immigrants from Scotland (91.8%, a difference of 0.040%), Polish (91.7%, a difference of 0.040%), Cajun (91.7%, a difference of 0.040%), and Immigrants from Iran (91.7%, a difference of 0.050%).
| Demographics | Rating | Rank | 1 or more Vehicles in Household |
| Thais | 99.8 /100 | #62 | Exceptional 91.9% |
| Chinese | 99.8 /100 | #63 | Exceptional 91.9% |
| Croatians | 99.8 /100 | #64 | Exceptional 91.9% |
| Immigrants from Laos | 99.8 /100 | #65 | Exceptional 91.8% |
| Canadians | 99.8 /100 | #66 | Exceptional 91.8% |
| Spaniards | 99.8 /100 | #67 | Exceptional 91.8% |
| Immigrants from Scotland | 99.7 /100 | #68 | Exceptional 91.8% |
| Palestinians | 99.7 /100 | #69 | Exceptional 91.7% |
| Lithuanians | 99.7 /100 | #70 | Exceptional 91.7% |
| Poles | 99.7 /100 | #71 | Exceptional 91.7% |
| Cajuns | 99.7 /100 | #72 | Exceptional 91.7% |
| Immigrants from Iran | 99.7 /100 | #73 | Exceptional 91.7% |
| Immigrants from Lebanon | 99.6 /100 | #74 | Exceptional 91.6% |
| Portuguese | 99.5 /100 | #75 | Exceptional 91.6% |
| Cubans | 99.5 /100 | #76 | Exceptional 91.5% |
Palestinian 1 or more Vehicles in Household Correlation Summary
| Measurement | Palestinian Data | 1 or more Vehicles in Household Data |
| Minimum | 0.038% | 86.4% |
| Maximum | 16.9% | 100.0% |
| Range | 16.9% | 13.6% |
| Mean | 3.7% | 94.9% |
| Median | 2.9% | 94.8% |
| Interquartile 25% (IQ1) | 1.4% | 92.6% |
| Interquartile 75% (IQ3) | 5.2% | 97.0% |
| Interquartile Range (IQR) | 3.8% | 4.4% |
| Standard Deviation (Sample) | 3.4% | 3.3% |
| Standard Deviation (Population) | 3.4% | 3.2% |
Correlation Details
| Palestinian Percentile | Sample Size | 1 or more Vehicles in Household |
[ 0.0% - 0.5% ] 0.038% | 136,174,872 | 87.4% |
[ 0.0% - 0.5% ] 0.12% | 42,624,536 | 90.1% |
[ 0.0% - 0.5% ] 0.21% | 12,816,653 | 92.8% |
[ 0.0% - 0.5% ] 0.29% | 7,966,770 | 92.3% |
[ 0.0% - 0.5% ] 0.38% | 4,898,734 | 92.2% |
[ 0.0% - 0.5% ] 0.47% | 2,805,153 | 93.5% |
[ 0.5% - 1.0% ] 0.55% | 1,758,332 | 91.5% |
[ 0.5% - 1.0% ] 0.63% | 1,400,816 | 94.3% |
[ 0.5% - 1.0% ] 0.71% | 1,108,174 | 92.9% |
[ 0.5% - 1.0% ] 0.80% | 494,913 | 93.7% |
[ 0.5% - 1.0% ] 0.90% | 801,883 | 94.8% |
[ 0.5% - 1.0% ] 0.98% | 533,871 | 94.1% |
[ 1.0% - 1.5% ] 1.06% | 381,797 | 94.8% |
[ 1.0% - 1.5% ] 1.14% | 269,854 | 95.5% |
[ 1.0% - 1.5% ] 1.22% | 257,921 | 94.1% |
[ 1.0% - 1.5% ] 1.30% | 452,606 | 93.7% |
[ 1.0% - 1.5% ] 1.40% | 53,323 | 93.3% |
[ 1.0% - 1.5% ] 1.48% | 96,359 | 91.7% |
[ 1.5% - 2.0% ] 1.57% | 210,045 | 93.4% |
[ 1.5% - 2.0% ] 1.65% | 195,446 | 94.9% |
[ 1.5% - 2.0% ] 1.73% | 52,070 | 94.7% |
[ 1.5% - 2.0% ] 1.80% | 69,876 | 95.0% |
[ 1.5% - 2.0% ] 1.89% | 88,001 | 86.4% |
[ 1.5% - 2.0% ] 1.97% | 59,828 | 90.8% |
[ 2.0% - 2.5% ] 2.06% | 104,816 | 94.6% |
[ 2.0% - 2.5% ] 2.24% | 11,815 | 99.0% |
[ 2.0% - 2.5% ] 2.32% | 42,595 | 97.0% |
[ 2.0% - 2.5% ] 2.41% | 91,580 | 96.1% |
[ 2.0% - 2.5% ] 2.50% | 76,650 | 96.9% |
[ 2.5% - 3.0% ] 2.60% | 14,176 | 90.9% |
[ 2.5% - 3.0% ] 2.66% | 10,859 | 89.0% |
[ 2.5% - 3.0% ] 2.79% | 2,508 | 100.0% |
[ 2.5% - 3.0% ] 2.82% | 7,946 | 99.4% |
[ 2.5% - 3.0% ] 2.91% | 22,318 | 93.7% |
[ 3.0% - 3.5% ] 3.02% | 34,224 | 95.0% |
[ 3.0% - 3.5% ] 3.21% | 68,870 | 96.5% |
[ 3.0% - 3.5% ] 3.24% | 2,222 | 96.5% |
[ 3.0% - 3.5% ] 3.37% | 4,830 | 94.7% |
[ 3.0% - 3.5% ] 3.40% | 36,556 | 95.1% |
[ 3.5% - 4.0% ] 3.53% | 14,360 | 92.6% |
[ 3.5% - 4.0% ] 3.64% | 43,709 | 96.9% |
[ 3.5% - 4.0% ] 3.68% | 2,090 | 91.6% |
[ 3.5% - 4.0% ] 3.81% | 4,018 | 98.3% |
[ 3.5% - 4.0% ] 3.83% | 8,065 | 96.0% |
[ 4.0% - 4.5% ] 4.03% | 23,437 | 94.6% |
[ 4.0% - 4.5% ] 4.37% | 5,121 | 100.0% |
[ 4.5% - 5.0% ] 4.53% | 11,787 | 98.7% |
[ 4.5% - 5.0% ] 4.66% | 794 | 91.9% |
[ 4.5% - 5.0% ] 4.75% | 1,053 | 97.9% |
[ 4.5% - 5.0% ] 4.89% | 3,050 | 99.0% |
[ 5.0% - 5.5% ] 5.16% | 3,447 | 99.7% |
[ 5.0% - 5.5% ] 5.27% | 3,379 | 99.7% |
[ 5.0% - 5.5% ] 5.47% | 4,222 | 98.6% |
[ 5.5% - 6.0% ] 5.54% | 2,059 | 100.0% |
[ 5.5% - 6.0% ] 5.93% | 26,198 | 97.9% |
[ 5.5% - 6.0% ] 5.98% | 14,915 | 96.7% |
[ 6.0% - 6.5% ] 6.09% | 14,650 | 96.6% |
[ 6.0% - 6.5% ] 6.22% | 46,933 | 91.2% |
[ 6.0% - 6.5% ] 6.31% | 16,939 | 90.3% |
[ 6.5% - 7.0% ] 6.70% | 2,970 | 92.6% |
[ 7.0% - 7.5% ] 7.03% | 5,022 | 94.1% |
[ 7.5% - 8.0% ] 7.84% | 1,428 | 96.3% |
[ 8.5% - 9.0% ] 8.82% | 68 | 100.0% |
[ 11.5% - 12.0% ] 11.79% | 212 | 100.0% |
[ 13.5% - 14.0% ] 13.56% | 826 | 100.0% |
[ 14.5% - 15.0% ] 14.95% | 6,842 | 96.6% |
[ 16.5% - 17.0% ] 16.95% | 59 | 91.4% |