Immigrants from South Africa Married-couple Households
COMPARE
Immigrants from South Africa
Select to Compare
Married-couple Households
Immigrants from South Africa Married-couple Households
47.8%
MARRIED-COUPLE HOUSEHOLDS
96.0/ 100
METRIC RATING
104th/ 347
METRIC RANK
Immigrants from South Africa Married-couple Households Correlation Chart
The statistical analysis conducted on geographies consisting of 233,270,946 people shows a weak positive correlation between the proportion of Immigrants from South Africa and percentage of married-couple family households in the United States with a correlation coefficient (R) of 0.206 and weighted average of 47.8%. On average, for every 1% (one percent) increase in Immigrants from South Africa within a typical geography, there is an increase of 0.39% in percentage of married-couple family households.
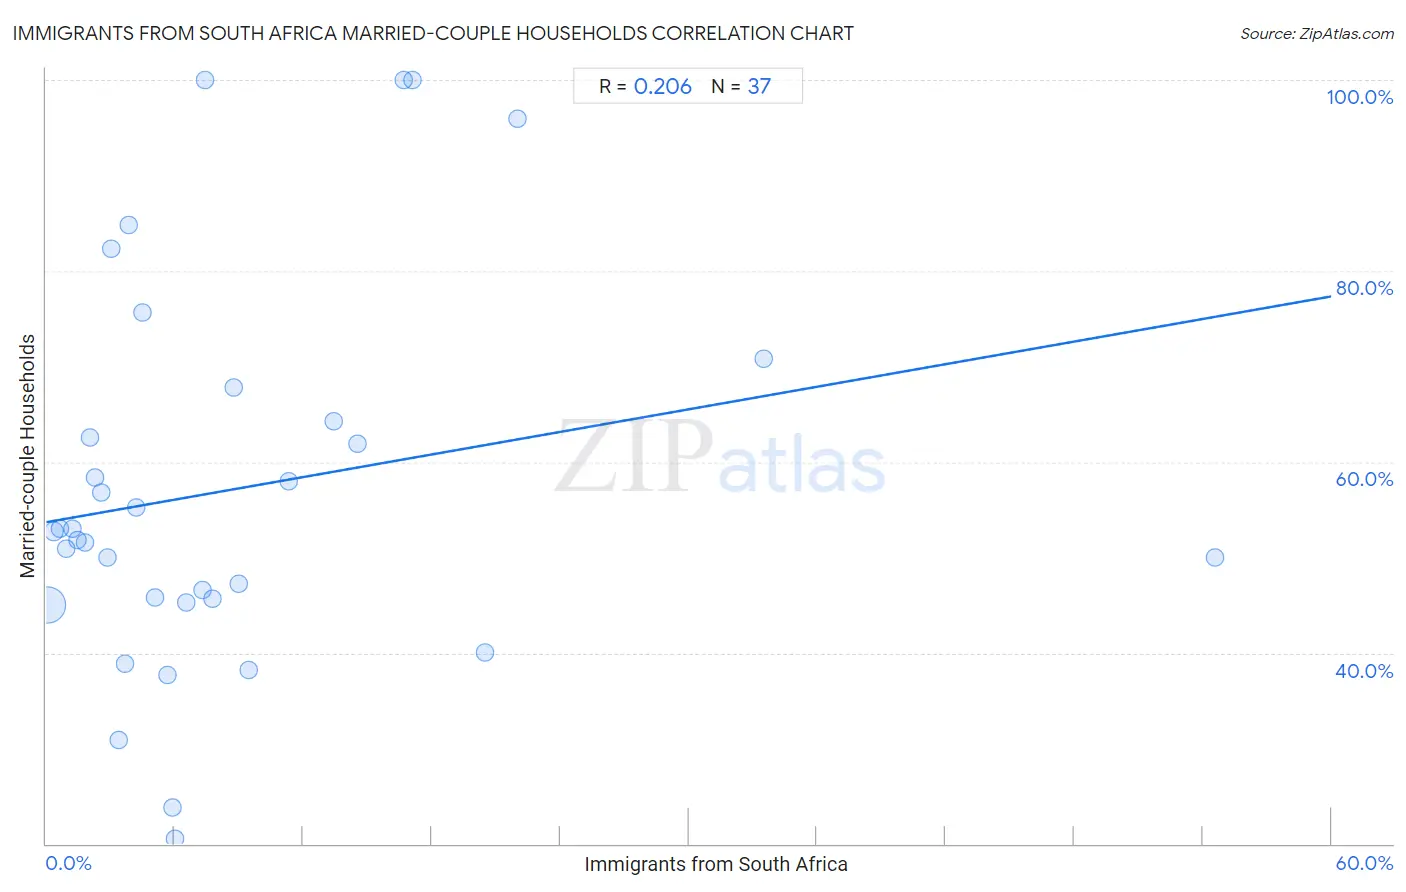
It is essential to understand that the correlation between the percentage of Immigrants from South Africa and percentage of married-couple family households does not imply a direct cause-and-effect relationship. It remains uncertain whether the presence of Immigrants from South Africa influences an upward or downward trend in the level of percentage of married-couple family households within an area, or if Immigrants from South Africa simply ended up residing in those areas with higher or lower levels of percentage of married-couple family households due to other factors.
Demographics Similar to Immigrants from South Africa by Married-couple Households
In terms of married-couple households, the demographic groups most similar to Immigrants from South Africa are Slavic (47.8%, a difference of 0.010%), Hawaiian (47.8%, a difference of 0.010%), Turkish (47.8%, a difference of 0.030%), Immigrants from Italy (47.9%, a difference of 0.090%), and Immigrants from Austria (47.9%, a difference of 0.10%).
| Demographics | Rating | Rank | Married-couple Households |
| Latvians | 96.5 /100 | #97 | Exceptional 47.9% |
| Immigrants from North Macedonia | 96.4 /100 | #98 | Exceptional 47.9% |
| Immigrants from Austria | 96.4 /100 | #99 | Exceptional 47.9% |
| Immigrants from Italy | 96.3 /100 | #100 | Exceptional 47.9% |
| Turks | 96.1 /100 | #101 | Exceptional 47.8% |
| Slavs | 96.0 /100 | #102 | Exceptional 47.8% |
| Hawaiians | 96.0 /100 | #103 | Exceptional 47.8% |
| Immigrants from South Africa | 96.0 /100 | #104 | Exceptional 47.8% |
| Immigrants from Czechoslovakia | 95.5 /100 | #105 | Exceptional 47.8% |
| Portuguese | 95.5 /100 | #106 | Exceptional 47.8% |
| Estonians | 94.7 /100 | #107 | Exceptional 47.7% |
| Immigrants from Japan | 94.4 /100 | #108 | Exceptional 47.7% |
| Immigrants from Jordan | 94.1 /100 | #109 | Exceptional 47.7% |
| Macedonians | 93.9 /100 | #110 | Exceptional 47.6% |
| Syrians | 93.9 /100 | #111 | Exceptional 47.6% |
Immigrants from South Africa Married-couple Households Correlation Summary
| Measurement | Immigrants from South Africa Data | Married-couple Households Data |
| Minimum | 0.064% | 20.5% |
| Maximum | 54.5% | 100.0% |
| Range | 54.5% | 79.5% |
| Mean | 8.7% | 57.1% |
| Median | 5.7% | 52.7% |
| Interquartile 25% (IQ1) | 2.4% | 45.5% |
| Interquartile 75% (IQ3) | 10.4% | 66.0% |
| Interquartile Range (IQR) | 8.0% | 20.6% |
| Standard Deviation (Sample) | 10.6% | 20.2% |
| Standard Deviation (Population) | 10.4% | 19.9% |
Correlation Details
| Immigrants from South Africa Percentile | Sample Size | Married-couple Households |
[ 0.0% - 0.5% ] 0.064% | 219,872,368 | 45.0% |
[ 0.0% - 0.5% ] 0.37% | 10,327,876 | 52.7% |
[ 0.5% - 1.0% ] 0.66% | 1,527,597 | 53.1% |
[ 0.5% - 1.0% ] 0.94% | 802,045 | 50.9% |
[ 1.0% - 1.5% ] 1.22% | 309,874 | 53.0% |
[ 1.0% - 1.5% ] 1.49% | 219,091 | 51.8% |
[ 1.5% - 2.0% ] 1.79% | 28,972 | 51.5% |
[ 2.0% - 2.5% ] 2.04% | 41,917 | 62.5% |
[ 2.0% - 2.5% ] 2.26% | 24,418 | 58.3% |
[ 2.5% - 3.0% ] 2.58% | 17,228 | 56.8% |
[ 2.5% - 3.0% ] 2.86% | 10,344 | 50.0% |
[ 3.0% - 3.5% ] 3.05% | 29,649 | 82.3% |
[ 3.0% - 3.5% ] 3.37% | 3,852 | 30.9% |
[ 3.5% - 4.0% ] 3.69% | 4,151 | 38.9% |
[ 3.5% - 4.0% ] 3.84% | 25,869 | 84.9% |
[ 4.0% - 4.5% ] 4.20% | 3,859 | 55.2% |
[ 4.0% - 4.5% ] 4.47% | 3,694 | 75.6% |
[ 5.0% - 5.5% ] 5.08% | 1,339 | 45.7% |
[ 5.5% - 6.0% ] 5.65% | 1,132 | 37.6% |
[ 5.5% - 6.0% ] 5.92% | 152 | 23.8% |
[ 6.0% - 6.5% ] 6.02% | 83 | 20.5% |
[ 6.5% - 7.0% ] 6.53% | 3,908 | 45.3% |
[ 7.0% - 7.5% ] 7.31% | 5,790 | 46.6% |
[ 7.0% - 7.5% ] 7.41% | 216 | 100.0% |
[ 7.5% - 8.0% ] 7.75% | 1,588 | 45.6% |
[ 8.5% - 9.0% ] 8.76% | 251 | 67.8% |
[ 9.0% - 9.5% ] 9.01% | 744 | 47.3% |
[ 9.0% - 9.5% ] 9.47% | 190 | 38.2% |
[ 11.0% - 11.5% ] 11.31% | 778 | 58.0% |
[ 13.0% - 13.5% ] 13.44% | 253 | 64.3% |
[ 14.5% - 15.0% ] 14.52% | 496 | 61.9% |
[ 16.5% - 17.0% ] 16.67% | 36 | 100.0% |
[ 17.0% - 17.5% ] 17.11% | 532 | 100.0% |
[ 20.0% - 20.5% ] 20.50% | 161 | 40.0% |
[ 22.0% - 22.5% ] 22.01% | 309 | 96.0% |
[ 33.5% - 34.0% ] 33.53% | 173 | 70.8% |
[ 54.5% - 55.0% ] 54.55% | 11 | 50.0% |