Immigrants from South Africa 2 or more Vehicles in Household

COMPARE

Immigrants from South Africa
Race
Ancestry
AfghanAfricanAlaska NativeAlaskan AthabascanAlbanianAleutAlsatianAmericanApacheArabArapahoArgentineanArmenianAssyrian/Chaldean/SyriacAustralianAustrianBahamianBangladeshiBarbadianBasqueBelgianBelizeanBermudanBhutaneseBlackfeetBolivianBrazilianBritishBritish West IndianBulgarianBurmeseCajunCambodianCanadianCape VerdeanCarpatho RusynCelticCentral AmericanCentral American IndianCherokeeCheyenneChickasawChileanChineseChippewaChoctawColombianColvilleComancheCosta RicanCreeCreekCroatianCrowCubanCypriotCzechCzechoslovakianDanishDelawareDominicanDutchDutch West IndianEastern EuropeanEcuadorianEgyptianEnglishEstonianEthiopianEuropeanFijianFilipinoFinnishFrenchFrench American IndianFrench CanadianGermanGerman RussianGhanaianGreekGuamanian/ChamorroGuatemalanGuyaneseHaitianHmongHonduranHopiHoumaHungarianIcelanderIndian (Asian)IndonesianInupiatIranianIraqiIrishIroquoisIsraeliItalianJamaicanJapaneseJordanianKenyanKiowaKoreanLaotianLatvianLebaneseLiberianLithuanianLumbeeLuxembourgerMacedonianMalaysianMalteseMarshalleseMenomineeMexicanMexican American IndianMongolianMoroccanNative HawaiianNavajoNepaleseNew ZealanderNicaraguanNigerianNorthern EuropeanNorwegianOkinawanOsageOttawaPaiutePakistaniPalestinianPanamanianParaguayanPennsylvania GermanPeruvianPimaPolishPortuguesePotawatomiPuebloPuerto RicanPuget Sound SalishRomanianRussianSalvadoranSamoanScandinavianScotch-IrishScottishSeminoleSenegaleseSerbianShoshoneSierra LeoneanSiouxSlavicSlovakSloveneSomaliSouth AfricanSouth AmericanSouth American IndianSoviet UnionSpaniardSpanishSpanish AmericanSpanish American IndianSri LankanSubsaharan AfricanSudaneseSwedishSwissSyrianTaiwaneseThaiTlingit-HaidaTohono O'OdhamTonganTrinidadian and TobagonianTsimshianTurkishU.S. Virgin IslanderUgandanUkrainianUruguayanUteVenezuelanVietnameseWelshWest IndianYakamaYaquiYugoslavianYumanYup'ikZimbabwean
Immigration
NonimmigrantsImmigrantsAfghanistanAfricaAlbaniaArgentinaArmeniaAsiaAustraliaAustriaBahamasBangladeshBarbadosBelarusBelgiumBelizeBoliviaBosnia and HerzegovinaBrazilBulgariaBurma/MyanmarCabo VerdeCambodiaCameroonCanadaCaribbeanCentral AmericaChileChinaColombiaCongoCosta RicaCroatiaCubaCzechoslovakiaDenmarkDominicaDominican RepublicEastern AfricaEastern AsiaEastern EuropeEcuadorEgyptEl SalvadorEnglandEritreaEthiopiaEuropeFijiFranceGermanyGhanaGreeceGrenadaGuatemalaGuyanaHaitiHondurasHong KongHungaryIndiaIndonesiaIranIraqIrelandIsraelItalyJamaicaJapanJordanKazakhstanKenyaKoreaKuwaitLaosLatin AmericaLatviaLebanonLiberiaLithuaniaMalaysiaMexicoMicronesiaMiddle AfricaMoldovaMoroccoNepalNetherlandsNicaraguaNigeriaNorth AmericaNorth MacedoniaNorthern AfricaNorthern EuropeNorwayOceaniaPakistanPanamaPeruPhilippinesPolandPortugalRomaniaRussiaSaudi ArabiaScotlandSenegalSerbiaSierra LeoneSingaporeSomaliaSouth AfricaSouth AmericaSouth Central AsiaSouth Eastern AsiaSouthern EuropeSpainSri LankaSt. Vincent and the GrenadinesSudanSwedenSwitzerlandSyriaTaiwanThailandTrinidad and TobagoTurkeyUgandaUkraineUruguayUzbekistanVenezuelaVietnamWest IndiesWestern AfricaWestern AsiaWestern EuropeYemenZaireZimbabweAzores
Select to Compare
Race
Ancestry
AfghanAfricanAlaska NativeAlaskan AthabascanAlbanianAleutAlsatianAmericanApacheArabArapahoArgentineanArmenianAssyrian/Chaldean/SyriacAustralianAustrianBahamianBangladeshiBarbadianBasqueBelgianBelizeanBermudanBhutaneseBlackfeetBolivianBrazilianBritishBritish West IndianBulgarianBurmeseCajunCambodianCanadianCape VerdeanCarpatho RusynCelticCentral AmericanCentral American IndianCherokeeCheyenneChickasawChileanChineseChippewaChoctawColombianColvilleComancheCosta RicanCreeCreekCroatianCrowCubanCypriotCzechCzechoslovakianDanishDelawareDominicanDutchDutch West IndianEastern EuropeanEcuadorianEgyptianEnglishEstonianEthiopianEuropeanFijianFilipinoFinnishFrenchFrench American IndianFrench CanadianGermanGerman RussianGhanaianGreekGuamanian/ChamorroGuatemalanGuyaneseHaitianHmongHonduranHopiHoumaHungarianIcelanderIndian (Asian)IndonesianInupiatIranianIraqiIrishIroquoisIsraeliItalianJamaicanJapaneseJordanianKenyanKiowaKoreanLaotianLatvianLebaneseLiberianLithuanianLumbeeLuxembourgerMacedonianMalaysianMalteseMarshalleseMenomineeMexicanMexican American IndianMongolianMoroccanNative HawaiianNavajoNepaleseNew ZealanderNicaraguanNigerianNorthern EuropeanNorwegianOkinawanOsageOttawaPaiutePakistaniPalestinianPanamanianParaguayanPennsylvania GermanPeruvianPimaPolishPortuguesePotawatomiPuebloPuerto RicanPuget Sound SalishRomanianRussianSalvadoranSamoanScandinavianScotch-IrishScottishSeminoleSenegaleseSerbianShoshoneSierra LeoneanSiouxSlavicSlovakSloveneSomaliSouth AfricanSouth AmericanSouth American IndianSoviet UnionSpaniardSpanishSpanish AmericanSpanish American IndianSri LankanSubsaharan AfricanSudaneseSwedishSwissSyrianTaiwaneseThaiTlingit-HaidaTohono O'OdhamTonganTrinidadian and TobagonianTsimshianTurkishU.S. Virgin IslanderUgandanUkrainianUruguayanUteVenezuelanVietnameseWelshWest IndianYakamaYaquiYugoslavianYumanYup'ikZimbabwean
Immigration
NonimmigrantsImmigrantsAfghanistanAfricaAlbaniaArgentinaArmeniaAsiaAustraliaAustriaBahamasBangladeshBarbadosBelarusBelgiumBelizeBoliviaBosnia and HerzegovinaBrazilBulgariaBurma/MyanmarCabo VerdeCambodiaCameroonCanadaCaribbeanCentral AmericaChileChinaColombiaCongoCosta RicaCroatiaCubaCzechoslovakiaDenmarkDominicaDominican RepublicEastern AfricaEastern AsiaEastern EuropeEcuadorEgyptEl SalvadorEnglandEritreaEthiopiaEuropeFijiFranceGermanyGhanaGreeceGrenadaGuatemalaGuyanaHaitiHondurasHong KongHungaryIndiaIndonesiaIranIraqIrelandIsraelItalyJamaicaJapanJordanKazakhstanKenyaKoreaKuwaitLaosLatin AmericaLatviaLebanonLiberiaLithuaniaMalaysiaMexicoMicronesiaMiddle AfricaMoldovaMoroccoNepalNetherlandsNicaraguaNigeriaNorth AmericaNorth MacedoniaNorthern AfricaNorthern EuropeNorwayOceaniaPakistanPanamaPeruPhilippinesPolandPortugalRomaniaRussiaSaudi ArabiaScotlandSenegalSerbiaSierra LeoneSingaporeSomaliaSouth AmericaSouth Central AsiaSouth Eastern AsiaSouthern EuropeSpainSri LankaSt. Vincent and the GrenadinesSudanSwedenSwitzerlandSyriaTaiwanThailandTrinidad and TobagoTurkeyUgandaUkraineUruguayUzbekistanVenezuelaVietnamWest IndiesWestern AfricaWestern AsiaWestern EuropeYemenZaireZimbabweAzores
2 or more Vehicles in Household
Income
Poverty
Unemployment
Labor Participation
Family Structure
Vehicle Availability
Education Level
Disability

Immigrants from South Africa 2 or more Vehicles in Household
Exceptional

56.7%
2+ VEHICLES AVAILABLE
92.5/ 100
METRIC RATING
122nd/ 347
METRIC RANK

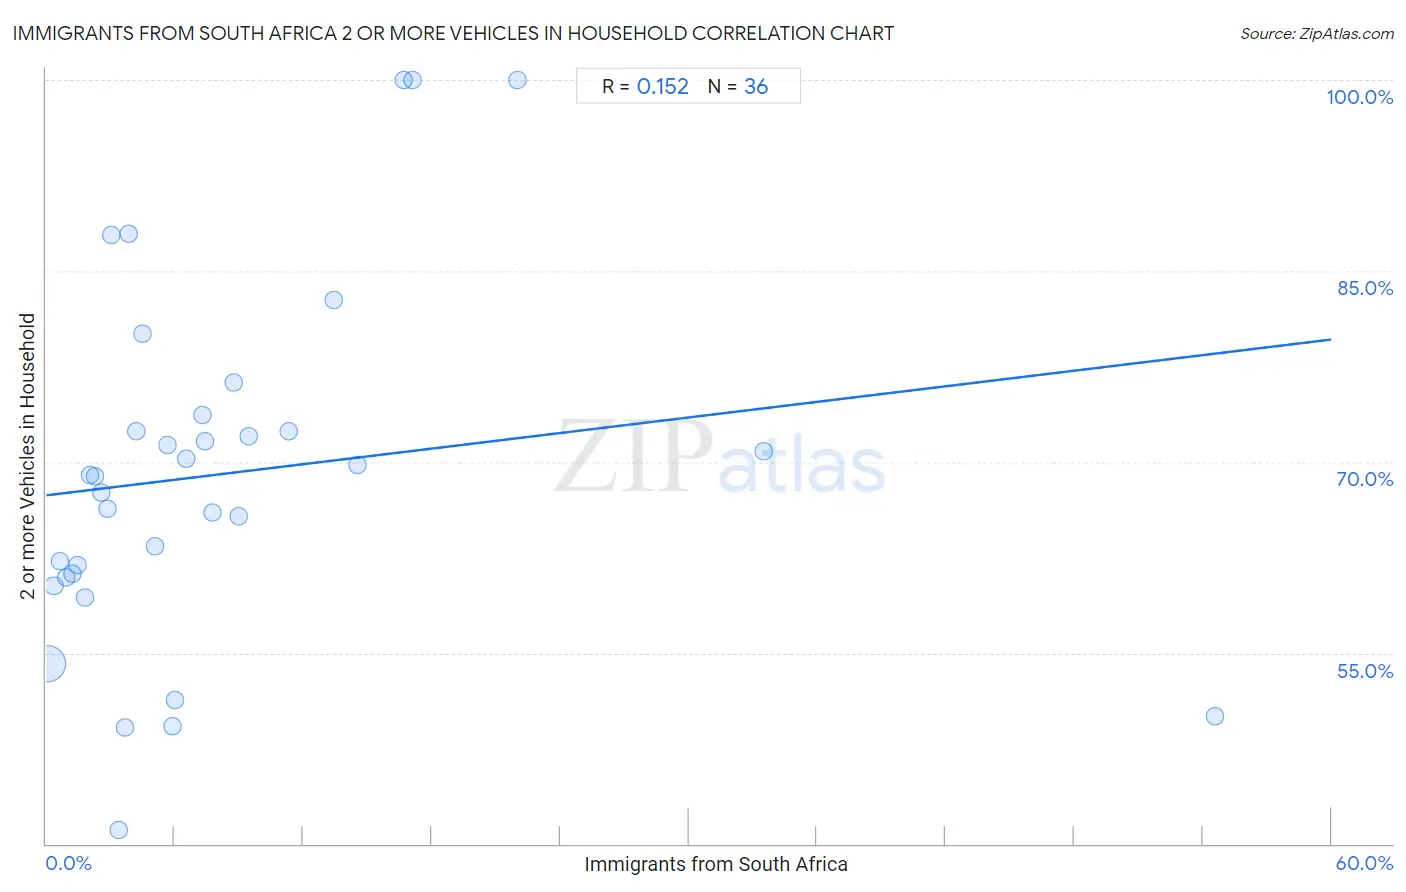
Immigrants from South Africa 2 or more Vehicles in Household Correlation Chart

The statistical analysis conducted on geographies consisting of 233,271,221 people shows a poor positive correlation between the proportion of Immigrants from South Africa and percentage of households with 2 or more vehicles available in the United States with a correlation coefficient (R) of 0.152 and weighted average of 56.7%. On average, for every 1% (one percent) increase in Immigrants from South Africa within a typical geography, there is an increase of 0.20% in percentage of households with 2 or more vehicles available.
Immigrants from South Africa 2 or more Vehicles in Household
It is essential to understand that the correlation between the percentage of Immigrants from South Africa and percentage of households with 2 or more vehicles available does not imply a direct cause-and-effect relationship. It remains uncertain whether the presence of Immigrants from South Africa influences an upward or downward trend in the level of percentage of households with 2 or more vehicles available within an area, or if Immigrants from South Africa simply ended up residing in those areas with higher or lower levels of percentage of households with 2 or more vehicles available due to other factors.

Demographics Similar to Immigrants from South Africa by 2 or more Vehicles in Household

In terms of 2 or more vehicles in household, the demographic groups most similar to Immigrants from South Africa are Australian (56.7%, a difference of 0.090%), New Zealander (56.7%, a difference of 0.10%), Tsimshian (56.7%, a difference of 0.12%), Sioux (56.8%, a difference of 0.20%), and Estonian (56.6%, a difference of 0.20%).
DemographicsRating | Rank2 or more Vehicles in Household
Chippewa
96.6
/100
|
#115
Exceptional
57.2%
Immigrants from Jordan
96.6
/100
|
#116
Exceptional
57.2%
Iraqis
95.8
/100
|
#117
Exceptional
57.1%
Asians
95.1
/100
|
#118
Exceptional
57.0%
Natives/Alaskans
95.0
/100
|
#119
Exceptional
57.0%
Costa Ricans
94.7
/100
|
#120
Exceptional
56.9%
Sioux
93.8
/100
|
#121
Exceptional
56.8%
Immigrants from South Africa
92.5
/100
|
#122
Exceptional
56.7%
Australians
91.8
/100
|
#123
Exceptional
56.7%
New Zealanders
91.8
/100
|
#124
Exceptional
56.7%
Tsimshian
91.6
/100
|
#125
Exceptional
56.7%
Estonians
90.9
/100
|
#126
Exceptional
56.6%
Immigrants from Thailand
90.7
/100
|
#127
Exceptional
56.6%
Immigrants from South Central Asia
90.5
/100
|
#128
Exceptional
56.6%
Ute
90.4
/100
|
#129
Exceptional
56.6%

Immigrants from South Africa 2 or more Vehicles in Household Correlation Summary

MeasurementImmigrants from South Africa Data2 or more Vehicles in Household Data
Minimum0.064%41.1%
Maximum54.5%100.0%
Range54.5%58.9%
Mean8.4%69.1%
Median5.4%69.0%
Interquartile 25% (IQ1)2.4%61.1%
Interquartile 75% (IQ3)9.2%73.1%
Interquartile Range (IQR)6.8%12.0%
Standard Deviation (Sample)10.5%14.1%
Standard Deviation (Population)10.4%13.9%

Correlation Details

Immigrants from South Africa PercentileSample Size2 or more Vehicles in Household
[
0.0%
-
0.5%
]
0.064%
219,872,36854.1%
[
0.0%
-
0.5%
]
0.37%
10,327,63260.3%
[
0.5%
-
1.0%
]
0.66%
1,527,59762.2%
[
0.5%
-
1.0%
]
0.94%
802,72561.0%
[
1.0%
-
1.5%
]
1.22%
309,87461.2%
[
1.0%
-
1.5%
]
1.49%
219,09161.9%
[
1.5%
-
2.0%
]
1.79%
28,97259.4%
[
2.0%
-
2.5%
]
2.04%
41,91769.0%
[
2.0%
-
2.5%
]
2.26%
24,41868.9%
[
2.5%
-
3.0%
]
2.58%
17,22867.6%
[
2.5%
-
3.0%
]
2.86%
10,34466.3%
[
3.0%
-
3.5%
]
3.05%
29,64987.9%
[
3.0%
-
3.5%
]
3.37%
3,85241.1%
[
3.5%
-
4.0%
]
3.69%
4,15149.1%
[
3.5%
-
4.0%
]
3.84%
25,86987.9%
[
4.0%
-
4.5%
]
4.20%
3,85972.5%
[
4.0%
-
4.5%
]
4.47%
3,69480.1%
[
5.0%
-
5.5%
]
5.08%
1,33963.3%
[
5.5%
-
6.0%
]
5.65%
1,13271.3%
[
5.5%
-
6.0%
]
5.92%
15249.2%
[
6.0%
-
6.5%
]
6.02%
8351.3%
[
6.5%
-
7.0%
]
6.53%
3,90870.2%
[
7.0%
-
7.5%
]
7.31%
5,79073.7%
[
7.0%
-
7.5%
]
7.41%
21671.6%
[
7.5%
-
8.0%
]
7.75%
1,58866.0%
[
8.5%
-
9.0%
]
8.76%
25176.3%
[
9.0%
-
9.5%
]
9.01%
74465.7%
[
9.0%
-
9.5%
]
9.47%
19072.1%
[
11.0%
-
11.5%
]
11.31%
77872.4%
[
13.0%
-
13.5%
]
13.44%
25382.8%
[
14.5%
-
15.0%
]
14.52%
49669.8%
[
16.5%
-
17.0%
]
16.67%
36100.0%
[
17.0%
-
17.5%
]
17.11%
532100.0%
[
22.0%
-
22.5%
]
22.01%
309100.0%
[
33.5%
-
34.0%
]
33.53%
17370.8%
[
54.5%
-
55.0%
]
54.55%
1150.0%