Immigrants from Scotland Wage/Income Gap

COMPARE

Immigrants from Scotland
Race
Ancestry
AfghanAfricanAlaska NativeAlaskan AthabascanAlbanianAleutAlsatianAmericanApacheArabArapahoArgentineanArmenianAssyrian/Chaldean/SyriacAustralianAustrianBahamianBangladeshiBarbadianBasqueBelgianBelizeanBermudanBhutaneseBlackfeetBolivianBrazilianBritishBritish West IndianBulgarianBurmeseCajunCambodianCanadianCape VerdeanCarpatho RusynCelticCentral AmericanCentral American IndianCherokeeCheyenneChickasawChileanChineseChippewaChoctawColombianColvilleComancheCosta RicanCreeCreekCroatianCrowCubanCypriotCzechCzechoslovakianDanishDelawareDominicanDutchDutch West IndianEastern EuropeanEcuadorianEgyptianEnglishEstonianEthiopianEuropeanFijianFilipinoFinnishFrenchFrench American IndianFrench CanadianGermanGerman RussianGhanaianGreekGuamanian/ChamorroGuatemalanGuyaneseHaitianHmongHonduranHopiHoumaHungarianIcelanderIndian (Asian)IndonesianInupiatIranianIraqiIrishIroquoisIsraeliItalianJamaicanJapaneseJordanianKenyanKiowaKoreanLaotianLatvianLebaneseLiberianLithuanianLumbeeLuxembourgerMacedonianMalaysianMalteseMarshalleseMenomineeMexicanMexican American IndianMongolianMoroccanNative HawaiianNavajoNepaleseNew ZealanderNicaraguanNigerianNorthern EuropeanNorwegianOkinawanOsageOttawaPaiutePakistaniPalestinianPanamanianParaguayanPennsylvania GermanPeruvianPimaPolishPortuguesePotawatomiPuebloPuerto RicanPuget Sound SalishRomanianRussianSalvadoranSamoanScandinavianScotch-IrishScottishSeminoleSenegaleseSerbianShoshoneSierra LeoneanSiouxSlavicSlovakSloveneSomaliSouth AfricanSouth AmericanSouth American IndianSoviet UnionSpaniardSpanishSpanish AmericanSpanish American IndianSri LankanSubsaharan AfricanSudaneseSwedishSwissSyrianTaiwaneseThaiTlingit-HaidaTohono O'OdhamTonganTrinidadian and TobagonianTsimshianTurkishU.S. Virgin IslanderUgandanUkrainianUruguayanUteVenezuelanVietnameseWelshWest IndianYakamaYaquiYugoslavianYumanYup'ikZimbabwean
Immigration
NonimmigrantsImmigrantsAfghanistanAfricaAlbaniaArgentinaArmeniaAsiaAustraliaAustriaBahamasBangladeshBarbadosBelarusBelgiumBelizeBoliviaBosnia and HerzegovinaBrazilBulgariaBurma/MyanmarCabo VerdeCambodiaCameroonCanadaCaribbeanCentral AmericaChileChinaColombiaCongoCosta RicaCroatiaCubaCzechoslovakiaDenmarkDominicaDominican RepublicEastern AfricaEastern AsiaEastern EuropeEcuadorEgyptEl SalvadorEnglandEritreaEthiopiaEuropeFijiFranceGermanyGhanaGreeceGrenadaGuatemalaGuyanaHaitiHondurasHong KongHungaryIndiaIndonesiaIranIraqIrelandIsraelItalyJamaicaJapanJordanKazakhstanKenyaKoreaKuwaitLaosLatin AmericaLatviaLebanonLiberiaLithuaniaMalaysiaMexicoMicronesiaMiddle AfricaMoldovaMoroccoNepalNetherlandsNicaraguaNigeriaNorth AmericaNorth MacedoniaNorthern AfricaNorthern EuropeNorwayOceaniaPakistanPanamaPeruPhilippinesPolandPortugalRomaniaRussiaSaudi ArabiaScotlandSenegalSerbiaSierra LeoneSingaporeSomaliaSouth AfricaSouth AmericaSouth Central AsiaSouth Eastern AsiaSouthern EuropeSpainSri LankaSt. Vincent and the GrenadinesSudanSwedenSwitzerlandSyriaTaiwanThailandTrinidad and TobagoTurkeyUgandaUkraineUruguayUzbekistanVenezuelaVietnamWest IndiesWestern AfricaWestern AsiaWestern EuropeYemenZaireZimbabweAzores
Select to Compare
Race
Ancestry
AfghanAfricanAlaska NativeAlaskan AthabascanAlbanianAleutAlsatianAmericanApacheArabArapahoArgentineanArmenianAssyrian/Chaldean/SyriacAustralianAustrianBahamianBangladeshiBarbadianBasqueBelgianBelizeanBermudanBhutaneseBlackfeetBolivianBrazilianBritishBritish West IndianBulgarianBurmeseCajunCambodianCanadianCape VerdeanCarpatho RusynCelticCentral AmericanCentral American IndianCherokeeCheyenneChickasawChileanChineseChippewaChoctawColombianColvilleComancheCosta RicanCreeCreekCroatianCrowCubanCypriotCzechCzechoslovakianDanishDelawareDominicanDutchDutch West IndianEastern EuropeanEcuadorianEgyptianEnglishEstonianEthiopianEuropeanFijianFilipinoFinnishFrenchFrench American IndianFrench CanadianGermanGerman RussianGhanaianGreekGuamanian/ChamorroGuatemalanGuyaneseHaitianHmongHonduranHopiHoumaHungarianIcelanderIndian (Asian)IndonesianInupiatIranianIraqiIrishIroquoisIsraeliItalianJamaicanJapaneseJordanianKenyanKiowaKoreanLaotianLatvianLebaneseLiberianLithuanianLumbeeLuxembourgerMacedonianMalaysianMalteseMarshalleseMenomineeMexicanMexican American IndianMongolianMoroccanNative HawaiianNavajoNepaleseNew ZealanderNicaraguanNigerianNorthern EuropeanNorwegianOkinawanOsageOttawaPaiutePakistaniPalestinianPanamanianParaguayanPennsylvania GermanPeruvianPimaPolishPortuguesePotawatomiPuebloPuerto RicanPuget Sound SalishRomanianRussianSalvadoranSamoanScandinavianScotch-IrishScottishSeminoleSenegaleseSerbianShoshoneSierra LeoneanSiouxSlavicSlovakSloveneSomaliSouth AfricanSouth AmericanSouth American IndianSoviet UnionSpaniardSpanishSpanish AmericanSpanish American IndianSri LankanSubsaharan AfricanSudaneseSwedishSwissSyrianTaiwaneseThaiTlingit-HaidaTohono O'OdhamTonganTrinidadian and TobagonianTsimshianTurkishU.S. Virgin IslanderUgandanUkrainianUruguayanUteVenezuelanVietnameseWelshWest IndianYakamaYaquiYugoslavianYumanYup'ikZimbabwean
Immigration
NonimmigrantsImmigrantsAfghanistanAfricaAlbaniaArgentinaArmeniaAsiaAustraliaAustriaBahamasBangladeshBarbadosBelarusBelgiumBelizeBoliviaBosnia and HerzegovinaBrazilBulgariaBurma/MyanmarCabo VerdeCambodiaCameroonCanadaCaribbeanCentral AmericaChileChinaColombiaCongoCosta RicaCroatiaCubaCzechoslovakiaDenmarkDominicaDominican RepublicEastern AfricaEastern AsiaEastern EuropeEcuadorEgyptEl SalvadorEnglandEritreaEthiopiaEuropeFijiFranceGermanyGhanaGreeceGrenadaGuatemalaGuyanaHaitiHondurasHong KongHungaryIndiaIndonesiaIranIraqIrelandIsraelItalyJamaicaJapanJordanKazakhstanKenyaKoreaKuwaitLaosLatin AmericaLatviaLebanonLiberiaLithuaniaMalaysiaMexicoMicronesiaMiddle AfricaMoldovaMoroccoNepalNetherlandsNicaraguaNigeriaNorth AmericaNorth MacedoniaNorthern AfricaNorthern EuropeNorwayOceaniaPakistanPanamaPeruPhilippinesPolandPortugalRomaniaRussiaSaudi ArabiaSenegalSerbiaSierra LeoneSingaporeSomaliaSouth AfricaSouth AmericaSouth Central AsiaSouth Eastern AsiaSouthern EuropeSpainSri LankaSt. Vincent and the GrenadinesSudanSwedenSwitzerlandSyriaTaiwanThailandTrinidad and TobagoTurkeyUgandaUkraineUruguayUzbekistanVenezuelaVietnamWest IndiesWestern AfricaWestern AsiaWestern EuropeYemenZaireZimbabweAzores
Wage/Income Gap
Income
Poverty
Unemployment
Labor Participation
Family Structure
Vehicle Availability
Education Level
Disability

Immigrants from Scotland Wage/Income Gap
Tragic

28.7%
WAGE/INCOME GAP
0.1/ 100
METRIC RATING
314th/ 347
METRIC RANK

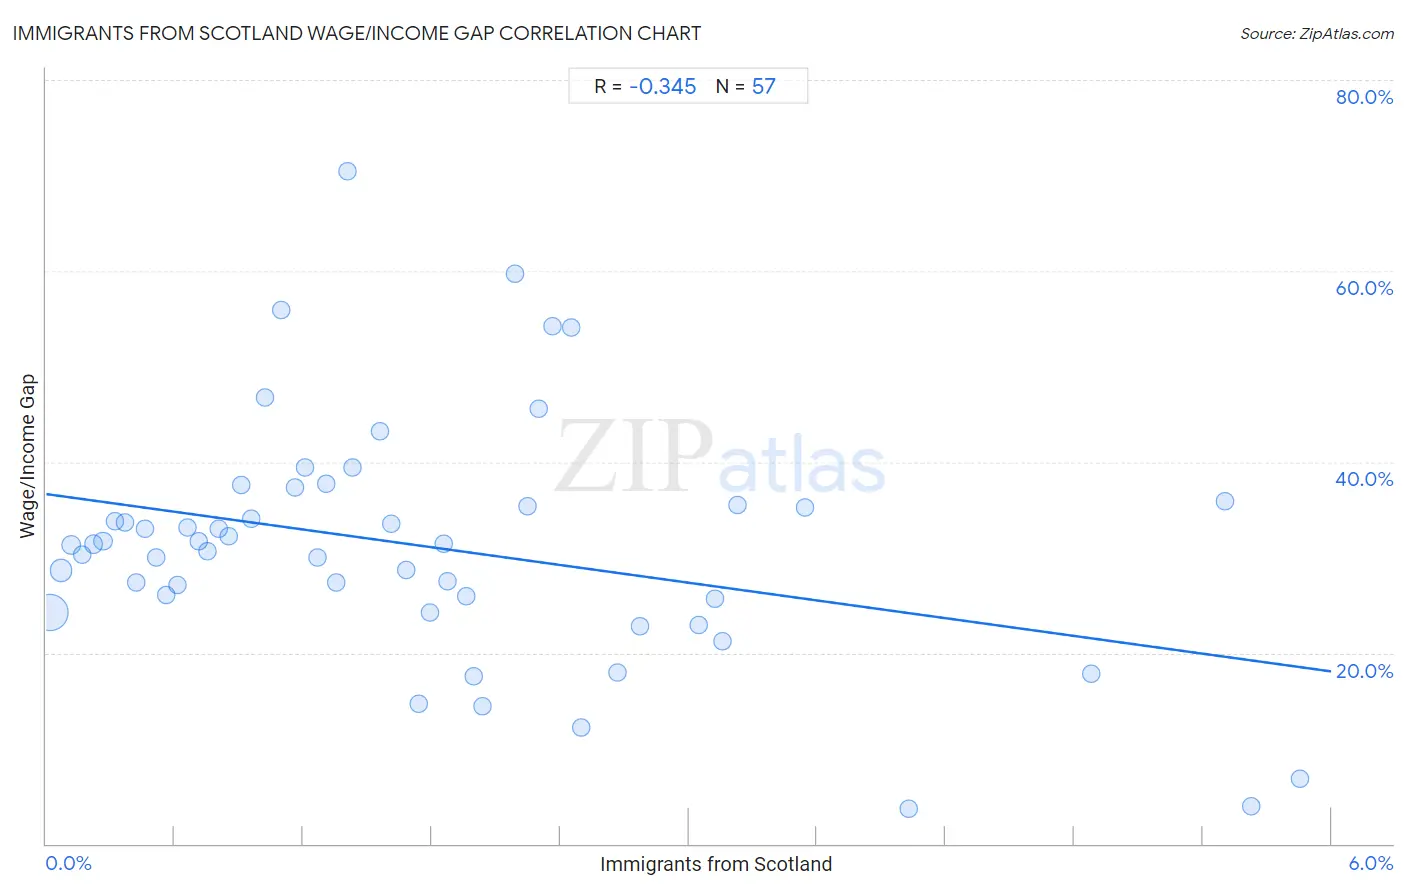
Immigrants from Scotland Wage/Income Gap Correlation Chart

The statistical analysis conducted on geographies consisting of 196,317,574 people shows a mild negative correlation between the proportion of Immigrants from Scotland and wage/income gap percentage in the United States with a correlation coefficient (R) of -0.345 and weighted average of 28.7%. On average, for every 1% (one percent) increase in Immigrants from Scotland within a typical geography, there is a decrease of 3.1% in wage/income gap percentage.
Immigrants from Scotland Wage/Income Gap
It is essential to understand that the correlation between the percentage of Immigrants from Scotland and wage/income gap percentage does not imply a direct cause-and-effect relationship. It remains uncertain whether the presence of Immigrants from Scotland influences an upward or downward trend in the level of wage/income gap percentage within an area, or if Immigrants from Scotland simply ended up residing in those areas with higher or lower levels of wage/income gap percentage due to other factors.

Demographics Similar to Immigrants from Scotland by Wage/Income Gap

In terms of wage/income gap, the demographic groups most similar to Immigrants from Scotland are Maltese (28.7%, a difference of 0.050%), Lithuanian (28.7%, a difference of 0.060%), French (28.7%, a difference of 0.15%), Belgian (28.8%, a difference of 0.17%), and Basque (28.8%, a difference of 0.22%).
DemographicsRating | RankWage/Income Gap
Immigrants from Denmark
0.1
/100
|
#307
Tragic
28.5%
Poles
0.1
/100
|
#308
Tragic
28.5%
Macedonians
0.1
/100
|
#309
Tragic
28.6%
Finns
0.1
/100
|
#310
Tragic
28.6%
Immigrants from Lithuania
0.1
/100
|
#311
Tragic
28.6%
Eastern Europeans
0.1
/100
|
#312
Tragic
28.6%
French
0.1
/100
|
#313
Tragic
28.7%
Immigrants from Scotland
0.1
/100
|
#314
Tragic
28.7%
Maltese
0.1
/100
|
#315
Tragic
28.7%
Lithuanians
0.1
/100
|
#316
Tragic
28.7%
Belgians
0.1
/100
|
#317
Tragic
28.8%
Basques
0.1
/100
|
#318
Tragic
28.8%
Slovaks
0.1
/100
|
#319
Tragic
28.9%
British
0.1
/100
|
#320
Tragic
28.9%
Welsh
0.1
/100
|
#321
Tragic
28.9%

Immigrants from Scotland Wage/Income Gap Correlation Summary

MeasurementImmigrants from Scotland DataWage/Income Gap Data
Minimum0.020%3.7%
Maximum5.9%70.5%
Range5.8%66.8%
Mean1.8%31.2%
Median1.4%31.4%
Interquartile 25% (IQ1)0.68%24.9%
Interquartile 75% (IQ3)2.4%35.7%
Interquartile Range (IQR)1.7%10.7%
Standard Deviation (Sample)1.4%12.7%
Standard Deviation (Population)1.4%12.6%

Correlation Details

Immigrants from Scotland PercentileSample SizeWage/Income Gap
[
0.0%
-
0.5%
]
0.020%
142,116,41824.3%
[
0.0%
-
0.5%
]
0.069%
31,280,21528.6%
[
0.0%
-
0.5%
]
0.12%
10,232,34131.3%
[
0.0%
-
0.5%
]
0.17%
4,809,66630.3%
[
0.0%
-
0.5%
]
0.22%
2,917,64031.4%
[
0.0%
-
0.5%
]
0.27%
1,413,18431.7%
[
0.0%
-
0.5%
]
0.32%
997,15033.8%
[
0.0%
-
0.5%
]
0.37%
585,06733.7%
[
0.0%
-
0.5%
]
0.42%
418,67527.3%
[
0.0%
-
0.5%
]
0.46%
383,06033.0%
[
0.5%
-
1.0%
]
0.51%
305,15630.0%
[
0.5%
-
1.0%
]
0.56%
102,95426.0%
[
0.5%
-
1.0%
]
0.61%
155,52527.0%
[
0.5%
-
1.0%
]
0.66%
106,09533.1%
[
0.5%
-
1.0%
]
0.71%
112,49631.7%
[
0.5%
-
1.0%
]
0.75%
31,83030.7%
[
0.5%
-
1.0%
]
0.81%
21,85433.0%
[
0.5%
-
1.0%
]
0.85%
60,19532.3%
[
0.5%
-
1.0%
]
0.91%
26,30537.6%
[
0.5%
-
1.0%
]
0.96%
33,68434.0%
[
1.0%
-
1.5%
]
1.02%
20,28846.7%
[
1.0%
-
1.5%
]
1.10%
4,27356.0%
[
1.0%
-
1.5%
]
1.16%
22,28937.4%
[
1.0%
-
1.5%
]
1.21%
3,56039.4%
[
1.0%
-
1.5%
]
1.27%
21,32830.0%
[
1.0%
-
1.5%
]
1.31%
1,52837.7%
[
1.0%
-
1.5%
]
1.35%
34,06127.3%
[
1.0%
-
1.5%
]
1.40%
19,36070.5%
[
1.0%
-
1.5%
]
1.43%
7,34039.4%
[
1.5%
-
2.0%
]
1.56%
2,43543.2%
[
1.5%
-
2.0%
]
1.61%
12,67833.5%
[
1.5%
-
2.0%
]
1.68%
3,32928.7%
[
1.5%
-
2.0%
]
1.74%
5,57014.7%
[
1.5%
-
2.0%
]
1.79%
27924.2%
[
1.5%
-
2.0%
]
1.86%
9,69531.4%
[
1.5%
-
2.0%
]
1.88%
5,06327.5%
[
1.5%
-
2.0%
]
1.96%
1,17225.9%
[
1.5%
-
2.0%
]
2.00%
9,51317.6%
[
2.0%
-
2.5%
]
2.03%
2,90014.4%
[
2.0%
-
2.5%
]
2.19%
13759.6%
[
2.0%
-
2.5%
]
2.24%
3,92035.3%
[
2.0%
-
2.5%
]
2.30%
1,26045.5%
[
2.0%
-
2.5%
]
2.36%
25454.2%
[
2.0%
-
2.5%
]
2.45%
16354.0%
[
2.0%
-
2.5%
]
2.50%
24012.2%
[
2.5%
-
3.0%
]
2.67%
1,08817.9%
[
2.5%
-
3.0%
]
2.77%
2,81122.8%
[
3.0%
-
3.5%
]
3.04%
3,12022.9%
[
3.0%
-
3.5%
]
3.12%
1,82425.6%
[
3.0%
-
3.5%
]
3.16%
88721.2%
[
3.0%
-
3.5%
]
3.23%
83735.4%
[
3.5%
-
4.0%
]
3.54%
1,10135.2%
[
4.0%
-
4.5%
]
4.03%
2983.7%
[
4.5%
-
5.0%
]
4.88%
1,82417.8%
[
5.5%
-
6.0%
]
5.50%
98135.9%
[
5.5%
-
6.0%
]
5.63%
2313.9%
[
5.5%
-
6.0%
]
5.85%
4276.8%