Immigrants from Scotland 2 or more Vehicles in Household
COMPARE
Immigrants from Scotland
Select to Compare
2 or more Vehicles in Household
Immigrants from Scotland 2 or more Vehicles in Household
58.9%
2+ VEHICLES AVAILABLE
99.8/ 100
METRIC RATING
58th/ 347
METRIC RANK
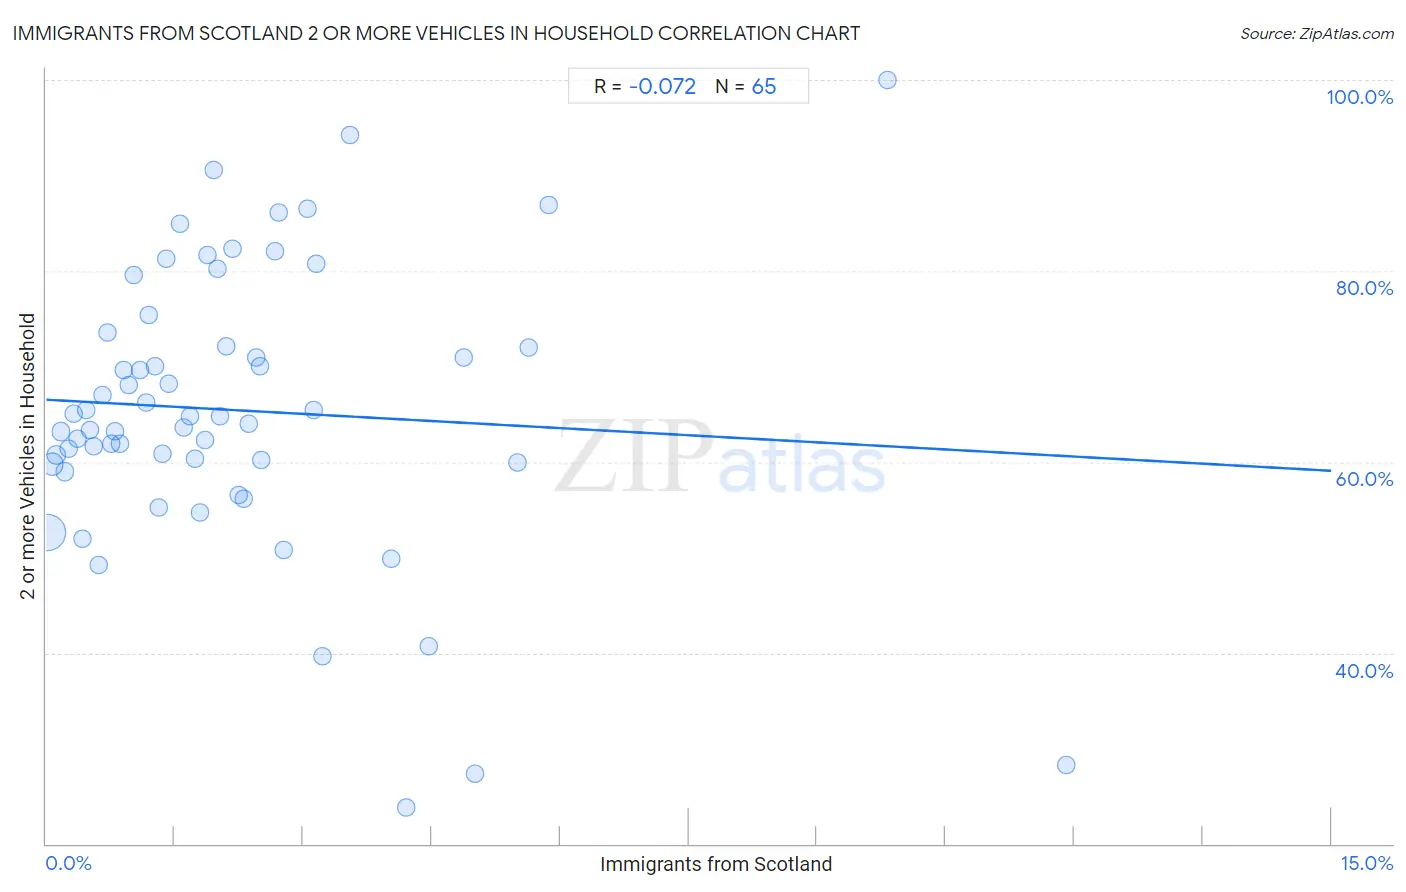
Immigrants from Scotland 2 or more Vehicles in Household Correlation Chart
The statistical analysis conducted on geographies consisting of 196,383,501 people shows a slight negative correlation between the proportion of Immigrants from Scotland and percentage of households with 2 or more vehicles available in the United States with a correlation coefficient (R) of -0.072 and weighted average of 58.9%. On average, for every 1% (one percent) increase in Immigrants from Scotland within a typical geography, there is a decrease of 0.50% in percentage of households with 2 or more vehicles available.
It is essential to understand that the correlation between the percentage of Immigrants from Scotland and percentage of households with 2 or more vehicles available does not imply a direct cause-and-effect relationship. It remains uncertain whether the presence of Immigrants from Scotland influences an upward or downward trend in the level of percentage of households with 2 or more vehicles available within an area, or if Immigrants from Scotland simply ended up residing in those areas with higher or lower levels of percentage of households with 2 or more vehicles available due to other factors.
Demographics Similar to Immigrants from Scotland by 2 or more Vehicles in Household
In terms of 2 or more vehicles in household, the demographic groups most similar to Immigrants from Scotland are Spanish American (58.9%, a difference of 0.020%), French Canadian (58.9%, a difference of 0.050%), Afghan (59.0%, a difference of 0.18%), Osage (58.8%, a difference of 0.18%), and Chickasaw (59.0%, a difference of 0.19%).
| Demographics | Rating | Rank | 2 or more Vehicles in Household |
| Spaniards | 99.9 /100 | #51 | Exceptional 59.2% |
| Immigrants from Laos | 99.9 /100 | #52 | Exceptional 59.2% |
| Celtics | 99.9 /100 | #53 | Exceptional 59.2% |
| Bhutanese | 99.9 /100 | #54 | Exceptional 59.1% |
| Luxembourgers | 99.9 /100 | #55 | Exceptional 59.1% |
| Chickasaw | 99.9 /100 | #56 | Exceptional 59.0% |
| Afghans | 99.9 /100 | #57 | Exceptional 59.0% |
| Immigrants from Scotland | 99.8 /100 | #58 | Exceptional 58.9% |
| Spanish Americans | 99.8 /100 | #59 | Exceptional 58.9% |
| French Canadians | 99.8 /100 | #60 | Exceptional 58.9% |
| Osage | 99.8 /100 | #61 | Exceptional 58.8% |
| Nonimmigrants | 99.8 /100 | #62 | Exceptional 58.8% |
| Mexican American Indians | 99.8 /100 | #63 | Exceptional 58.7% |
| Portuguese | 99.7 /100 | #64 | Exceptional 58.6% |
| Immigrants from Central America | 99.7 /100 | #65 | Exceptional 58.6% |
Immigrants from Scotland 2 or more Vehicles in Household Correlation Summary
| Measurement | Immigrants from Scotland Data | 2 or more Vehicles in Household Data |
| Minimum | 0.020% | 23.8% |
| Maximum | 11.9% | 100.0% |
| Range | 11.9% | 76.2% |
| Mean | 2.2% | 65.4% |
| Median | 1.7% | 64.8% |
| Interquartile 25% (IQ1) | 0.78% | 59.9% |
| Interquartile 75% (IQ3) | 2.7% | 72.8% |
| Interquartile Range (IQR) | 2.0% | 13.0% |
| Standard Deviation (Sample) | 2.1% | 14.8% |
| Standard Deviation (Population) | 2.1% | 14.7% |
Correlation Details
| Immigrants from Scotland Percentile | Sample Size | 2 or more Vehicles in Household |
[ 0.0% - 0.5% ] 0.020% | 142,116,418 | 52.6% |
[ 0.0% - 0.5% ] 0.069% | 31,278,689 | 59.8% |
[ 0.0% - 0.5% ] 0.12% | 10,231,361 | 60.8% |
[ 0.0% - 0.5% ] 0.17% | 4,808,990 | 63.2% |
[ 0.0% - 0.5% ] 0.22% | 2,927,462 | 59.0% |
[ 0.0% - 0.5% ] 0.27% | 1,423,089 | 61.4% |
[ 0.0% - 0.5% ] 0.32% | 1,001,319 | 65.1% |
[ 0.0% - 0.5% ] 0.37% | 591,540 | 62.4% |
[ 0.0% - 0.5% ] 0.42% | 420,893 | 52.0% |
[ 0.0% - 0.5% ] 0.46% | 383,692 | 65.4% |
[ 0.5% - 1.0% ] 0.51% | 308,006 | 63.4% |
[ 0.5% - 1.0% ] 0.56% | 110,700 | 61.6% |
[ 0.5% - 1.0% ] 0.61% | 153,978 | 49.2% |
[ 0.5% - 1.0% ] 0.66% | 108,196 | 67.0% |
[ 0.5% - 1.0% ] 0.71% | 113,635 | 73.5% |
[ 0.5% - 1.0% ] 0.75% | 32,359 | 61.9% |
[ 0.5% - 1.0% ] 0.81% | 22,354 | 63.2% |
[ 0.5% - 1.0% ] 0.85% | 60,654 | 61.9% |
[ 0.5% - 1.0% ] 0.91% | 26,979 | 69.6% |
[ 0.5% - 1.0% ] 0.96% | 33,684 | 68.0% |
[ 1.0% - 1.5% ] 1.02% | 20,482 | 79.6% |
[ 1.0% - 1.5% ] 1.10% | 5,265 | 69.6% |
[ 1.0% - 1.5% ] 1.16% | 22,289 | 66.2% |
[ 1.0% - 1.5% ] 1.20% | 6,412 | 75.3% |
[ 1.0% - 1.5% ] 1.26% | 21,979 | 70.0% |
[ 1.0% - 1.5% ] 1.31% | 1,528 | 55.2% |
[ 1.0% - 1.5% ] 1.35% | 34,211 | 60.9% |
[ 1.0% - 1.5% ] 1.40% | 19,360 | 81.3% |
[ 1.0% - 1.5% ] 1.43% | 8,022 | 68.1% |
[ 1.5% - 2.0% ] 1.56% | 2,435 | 84.9% |
[ 1.5% - 2.0% ] 1.61% | 12,678 | 63.5% |
[ 1.5% - 2.0% ] 1.68% | 3,329 | 64.8% |
[ 1.5% - 2.0% ] 1.74% | 8,568 | 60.3% |
[ 1.5% - 2.0% ] 1.79% | 279 | 54.7% |
[ 1.5% - 2.0% ] 1.86% | 9,695 | 62.3% |
[ 1.5% - 2.0% ] 1.88% | 5,063 | 81.6% |
[ 1.5% - 2.0% ] 1.96% | 1,172 | 90.6% |
[ 1.5% - 2.0% ] 2.00% | 9,513 | 80.2% |
[ 2.0% - 2.5% ] 2.03% | 2,900 | 64.8% |
[ 2.0% - 2.5% ] 2.10% | 238 | 72.2% |
[ 2.0% - 2.5% ] 2.18% | 2,160 | 82.3% |
[ 2.0% - 2.5% ] 2.24% | 3,920 | 56.5% |
[ 2.0% - 2.5% ] 2.30% | 1,260 | 56.2% |
[ 2.0% - 2.5% ] 2.36% | 254 | 64.0% |
[ 2.0% - 2.5% ] 2.45% | 163 | 71.0% |
[ 2.0% - 2.5% ] 2.50% | 240 | 70.0% |
[ 2.5% - 3.0% ] 2.51% | 598 | 60.2% |
[ 2.5% - 3.0% ] 2.67% | 1,462 | 82.0% |
[ 2.5% - 3.0% ] 2.71% | 6,051 | 86.1% |
[ 2.5% - 3.0% ] 2.77% | 4,880 | 50.8% |
[ 3.0% - 3.5% ] 3.04% | 3,120 | 86.5% |
[ 3.0% - 3.5% ] 3.12% | 1,824 | 65.4% |
[ 3.0% - 3.5% ] 3.16% | 887 | 80.8% |
[ 3.0% - 3.5% ] 3.23% | 837 | 39.7% |
[ 3.5% - 4.0% ] 3.54% | 1,101 | 94.2% |
[ 4.0% - 4.5% ] 4.02% | 547 | 49.9% |
[ 4.0% - 4.5% ] 4.20% | 143 | 23.8% |
[ 4.0% - 4.5% ] 4.47% | 470 | 40.7% |
[ 4.5% - 5.0% ] 4.88% | 1,824 | 71.0% |
[ 5.0% - 5.5% ] 5.00% | 20 | 27.3% |
[ 5.5% - 6.0% ] 5.50% | 981 | 60.0% |
[ 5.5% - 6.0% ] 5.63% | 231 | 72.0% |
[ 5.5% - 6.0% ] 5.86% | 631 | 87.0% |
[ 9.5% - 10.0% ] 9.82% | 397 | 100.0% |
[ 11.5% - 12.0% ] 11.90% | 84 | 28.2% |