Immigrants from France GED/Equivalency
COMPARE
Immigrants from France
Select to Compare
GED/Equivalency
Immigrants from France GED/Equivalency
87.8%
GED/EQUIVALENCY
99.1/ 100
METRIC RATING
68th/ 347
METRIC RANK
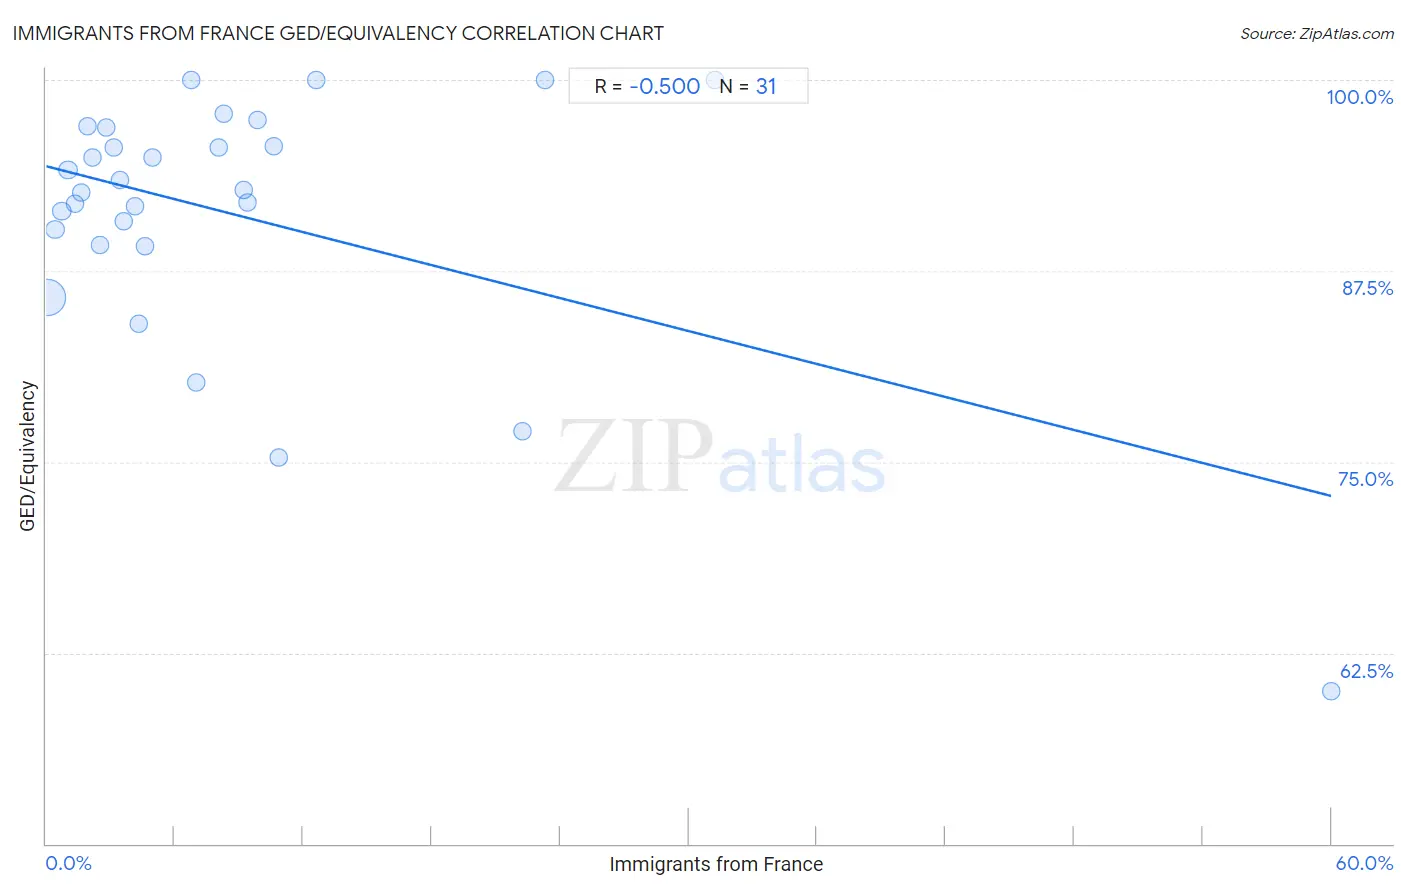
Immigrants from France GED/Equivalency Correlation Chart
The statistical analysis conducted on geographies consisting of 287,920,906 people shows a substantial negative correlation between the proportion of Immigrants from France and percentage of population with at least ged/equivalency education in the United States with a correlation coefficient (R) of -0.500 and weighted average of 87.8%. On average, for every 1% (one percent) increase in Immigrants from France within a typical geography, there is a decrease of 0.36% in percentage of population with at least ged/equivalency education.
It is essential to understand that the correlation between the percentage of Immigrants from France and percentage of population with at least ged/equivalency education does not imply a direct cause-and-effect relationship. It remains uncertain whether the presence of Immigrants from France influences an upward or downward trend in the level of percentage of population with at least ged/equivalency education within an area, or if Immigrants from France simply ended up residing in those areas with higher or lower levels of percentage of population with at least ged/equivalency education due to other factors.
Demographics Similar to Immigrants from France by GED/Equivalency
In terms of ged/equivalency, the demographic groups most similar to Immigrants from France are British (87.8%, a difference of 0.0%), Immigrants from Bulgaria (87.8%, a difference of 0.010%), Immigrants from North America (87.8%, a difference of 0.020%), Immigrants from Canada (87.9%, a difference of 0.050%), and Immigrants from Saudi Arabia (87.8%, a difference of 0.070%).
| Demographics | Rating | Rank | GED/Equivalency |
| Europeans | 99.3 /100 | #61 | Exceptional 87.9% |
| Germans | 99.3 /100 | #62 | Exceptional 87.9% |
| Immigrants from Turkey | 99.2 /100 | #63 | Exceptional 87.9% |
| Immigrants from Canada | 99.2 /100 | #64 | Exceptional 87.9% |
| Immigrants from North America | 99.1 /100 | #65 | Exceptional 87.8% |
| Immigrants from Bulgaria | 99.1 /100 | #66 | Exceptional 87.8% |
| British | 99.1 /100 | #67 | Exceptional 87.8% |
| Immigrants from France | 99.1 /100 | #68 | Exceptional 87.8% |
| Immigrants from Saudi Arabia | 99.0 /100 | #69 | Exceptional 87.8% |
| Ukrainians | 98.8 /100 | #70 | Exceptional 87.7% |
| Austrians | 98.8 /100 | #71 | Exceptional 87.7% |
| Immigrants from Moldova | 98.8 /100 | #72 | Exceptional 87.7% |
| Belgians | 98.8 /100 | #73 | Exceptional 87.7% |
| Immigrants from Kuwait | 98.8 /100 | #74 | Exceptional 87.7% |
| Scottish | 98.7 /100 | #75 | Exceptional 87.7% |
Immigrants from France GED/Equivalency Correlation Summary
| Measurement | Immigrants from France Data | GED/Equivalency Data |
| Minimum | 0.082% | 60.0% |
| Maximum | 60.0% | 100.0% |
| Range | 59.9% | 40.0% |
| Mean | 8.8% | 91.2% |
| Median | 4.6% | 92.8% |
| Interquartile 25% (IQ1) | 2.2% | 89.2% |
| Interquartile 75% (IQ3) | 9.8% | 96.9% |
| Interquartile Range (IQR) | 7.7% | 7.7% |
| Standard Deviation (Sample) | 11.9% | 8.6% |
| Standard Deviation (Population) | 11.7% | 8.4% |
Correlation Details
| Immigrants from France Percentile | Sample Size | GED/Equivalency |
[ 0.0% - 0.5% ] 0.082% | 266,697,359 | 85.8% |
[ 0.0% - 0.5% ] 0.42% | 14,584,907 | 90.2% |
[ 0.5% - 1.0% ] 0.72% | 3,862,862 | 91.4% |
[ 1.0% - 1.5% ] 1.02% | 1,368,861 | 94.1% |
[ 1.0% - 1.5% ] 1.32% | 825,890 | 91.9% |
[ 1.5% - 2.0% ] 1.63% | 365,005 | 92.6% |
[ 1.5% - 2.0% ] 1.92% | 83,861 | 97.0% |
[ 2.0% - 2.5% ] 2.16% | 25,161 | 94.9% |
[ 2.5% - 3.0% ] 2.53% | 15,928 | 89.2% |
[ 2.5% - 3.0% ] 2.82% | 30,009 | 96.9% |
[ 3.0% - 3.5% ] 3.16% | 16,588 | 95.5% |
[ 3.0% - 3.5% ] 3.45% | 13,540 | 93.5% |
[ 3.5% - 4.0% ] 3.64% | 9,386 | 90.7% |
[ 4.0% - 4.5% ] 4.13% | 3,248 | 91.7% |
[ 4.0% - 4.5% ] 4.32% | 880 | 84.0% |
[ 4.5% - 5.0% ] 4.62% | 1,451 | 89.1% |
[ 4.5% - 5.0% ] 4.97% | 8,772 | 95.0% |
[ 6.5% - 7.0% ] 6.76% | 222 | 100.0% |
[ 7.0% - 7.5% ] 7.00% | 100 | 80.2% |
[ 8.0% - 8.5% ] 8.04% | 1,481 | 95.6% |
[ 8.0% - 8.5% ] 8.31% | 1,588 | 97.8% |
[ 9.0% - 9.5% ] 9.23% | 1,105 | 92.8% |
[ 9.0% - 9.5% ] 9.39% | 1,523 | 92.0% |
[ 9.5% - 10.0% ] 9.84% | 61 | 97.4% |
[ 10.5% - 11.0% ] 10.60% | 217 | 95.7% |
[ 10.5% - 11.0% ] 10.87% | 92 | 75.3% |
[ 12.5% - 13.0% ] 12.63% | 95 | 100.0% |
[ 22.0% - 22.5% ] 22.26% | 274 | 77.0% |
[ 23.0% - 23.5% ] 23.31% | 399 | 100.0% |
[ 31.0% - 31.5% ] 31.25% | 16 | 100.0% |
[ 60.0% - 60.5% ] 60.00% | 25 | 60.0% |