Immigrants from France 2 or more Vehicles in Household
COMPARE
Immigrants from France
Select to Compare
2 or more Vehicles in Household
Immigrants from France 2 or more Vehicles in Household
52.0%
2+ VEHICLES AVAILABLE
0.2/ 100
METRIC RATING
266th/ 347
METRIC RANK
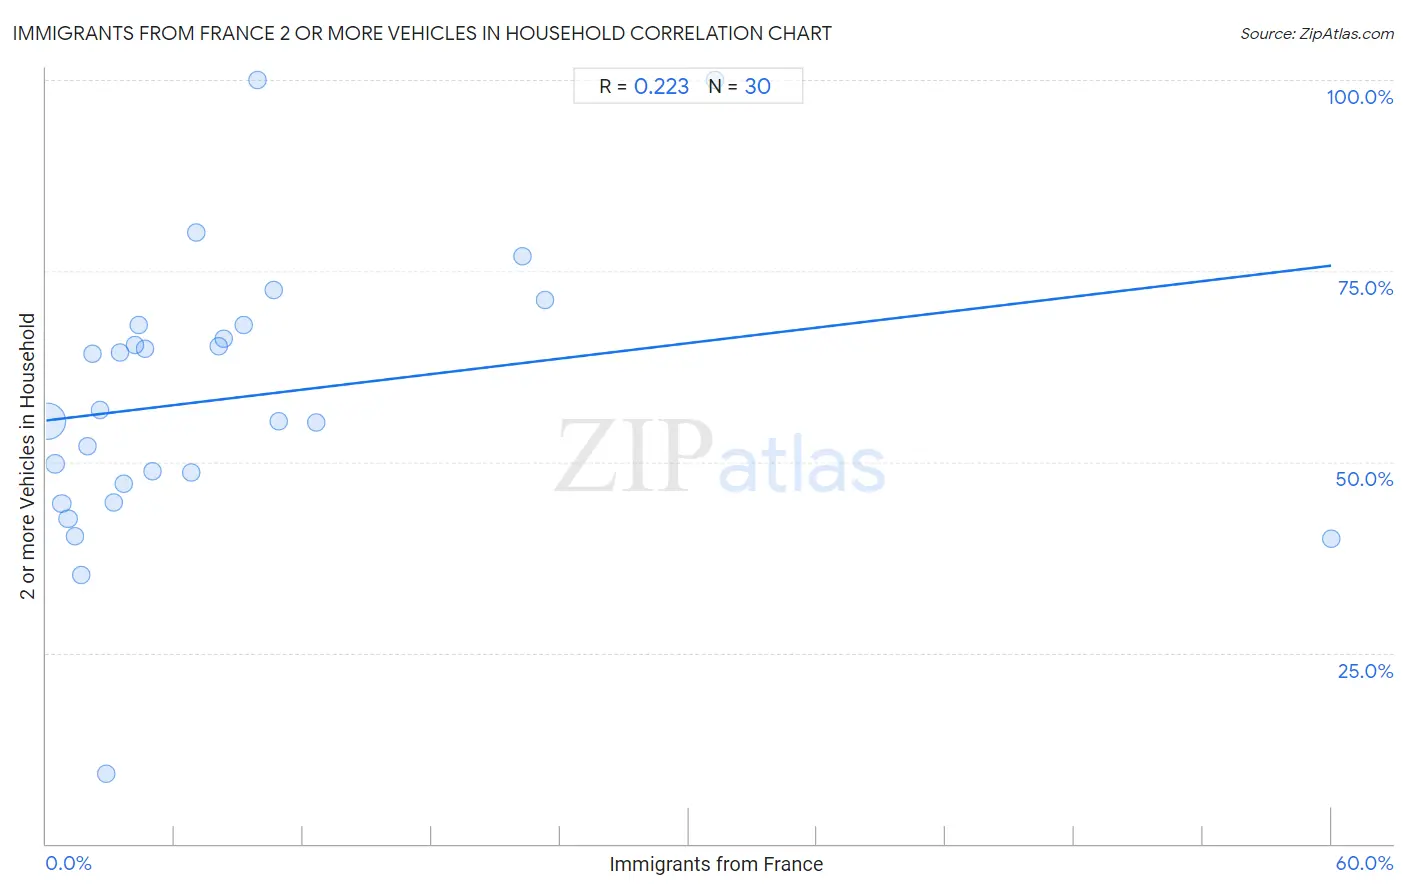
Immigrants from France 2 or more Vehicles in Household Correlation Chart
The statistical analysis conducted on geographies consisting of 287,851,745 people shows a weak positive correlation between the proportion of Immigrants from France and percentage of households with 2 or more vehicles available in the United States with a correlation coefficient (R) of 0.223 and weighted average of 52.0%. On average, for every 1% (one percent) increase in Immigrants from France within a typical geography, there is an increase of 0.34% in percentage of households with 2 or more vehicles available.
It is essential to understand that the correlation between the percentage of Immigrants from France and percentage of households with 2 or more vehicles available does not imply a direct cause-and-effect relationship. It remains uncertain whether the presence of Immigrants from France influences an upward or downward trend in the level of percentage of households with 2 or more vehicles available within an area, or if Immigrants from France simply ended up residing in those areas with higher or lower levels of percentage of households with 2 or more vehicles available due to other factors.
Demographics Similar to Immigrants from France by 2 or more Vehicles in Household
In terms of 2 or more vehicles in household, the demographic groups most similar to Immigrants from France are Immigrants from Colombia (52.0%, a difference of 0.050%), Pima (52.0%, a difference of 0.060%), Honduran (52.0%, a difference of 0.060%), Immigrants from Ireland (52.0%, a difference of 0.080%), and Immigrants from Congo (52.1%, a difference of 0.14%).
| Demographics | Rating | Rank | 2 or more Vehicles in Household |
| Alsatians | 0.6 /100 | #259 | Tragic 52.5% |
| Immigrants from Bahamas | 0.5 /100 | #260 | Tragic 52.5% |
| Immigrants from Australia | 0.5 /100 | #261 | Tragic 52.4% |
| Immigrants from Northern Africa | 0.4 /100 | #262 | Tragic 52.3% |
| Immigrants from Southern Europe | 0.4 /100 | #263 | Tragic 52.3% |
| Immigrants from Latvia | 0.4 /100 | #264 | Tragic 52.2% |
| Immigrants from Congo | 0.3 /100 | #265 | Tragic 52.1% |
| Immigrants from France | 0.2 /100 | #266 | Tragic 52.0% |
| Immigrants from Colombia | 0.2 /100 | #267 | Tragic 52.0% |
| Pima | 0.2 /100 | #268 | Tragic 52.0% |
| Hondurans | 0.2 /100 | #269 | Tragic 52.0% |
| Immigrants from Ireland | 0.2 /100 | #270 | Tragic 52.0% |
| South Americans | 0.2 /100 | #271 | Tragic 51.9% |
| Sub-Saharan Africans | 0.2 /100 | #272 | Tragic 51.9% |
| Israelis | 0.2 /100 | #273 | Tragic 51.9% |
Immigrants from France 2 or more Vehicles in Household Correlation Summary
| Measurement | Immigrants from France Data | 2 or more Vehicles in Household Data |
| Minimum | 0.082% | 9.2% |
| Maximum | 60.0% | 100.0% |
| Range | 59.9% | 90.8% |
| Mean | 8.8% | 58.4% |
| Median | 4.5% | 56.1% |
| Interquartile 25% (IQ1) | 2.2% | 47.1% |
| Interquartile 75% (IQ3) | 9.8% | 68.0% |
| Interquartile Range (IQR) | 7.7% | 20.9% |
| Standard Deviation (Sample) | 12.1% | 18.4% |
| Standard Deviation (Population) | 11.9% | 18.1% |
Correlation Details
| Immigrants from France Percentile | Sample Size | 2 or more Vehicles in Household |
[ 0.0% - 0.5% ] 0.082% | 266,676,156 | 55.4% |
[ 0.0% - 0.5% ] 0.42% | 14,565,141 | 49.7% |
[ 0.5% - 1.0% ] 0.72% | 3,852,634 | 44.5% |
[ 1.0% - 1.5% ] 1.02% | 1,367,942 | 42.5% |
[ 1.0% - 1.5% ] 1.32% | 825,332 | 40.3% |
[ 1.5% - 2.0% ] 1.64% | 356,250 | 35.2% |
[ 1.5% - 2.0% ] 1.92% | 83,861 | 52.1% |
[ 2.0% - 2.5% ] 2.16% | 25,161 | 64.2% |
[ 2.5% - 3.0% ] 2.52% | 13,934 | 56.8% |
[ 2.5% - 3.0% ] 2.82% | 27,988 | 9.2% |
[ 3.0% - 3.5% ] 3.16% | 16,342 | 44.6% |
[ 3.0% - 3.5% ] 3.44% | 11,755 | 64.3% |
[ 3.5% - 4.0% ] 3.64% | 9,386 | 47.1% |
[ 4.0% - 4.5% ] 4.13% | 3,248 | 65.4% |
[ 4.0% - 4.5% ] 4.32% | 880 | 68.0% |
[ 4.5% - 5.0% ] 4.62% | 1,451 | 64.8% |
[ 4.5% - 5.0% ] 4.97% | 8,609 | 48.8% |
[ 6.5% - 7.0% ] 6.76% | 222 | 48.6% |
[ 7.0% - 7.5% ] 7.00% | 100 | 80.0% |
[ 8.0% - 8.5% ] 8.04% | 1,481 | 65.2% |
[ 8.0% - 8.5% ] 8.31% | 1,588 | 66.1% |
[ 9.0% - 9.5% ] 9.23% | 1,105 | 68.0% |
[ 9.5% - 10.0% ] 9.84% | 61 | 100.0% |
[ 10.5% - 11.0% ] 10.60% | 217 | 72.5% |
[ 10.5% - 11.0% ] 10.87% | 92 | 55.3% |
[ 12.5% - 13.0% ] 12.63% | 95 | 55.1% |
[ 22.0% - 22.5% ] 22.26% | 274 | 76.9% |
[ 23.0% - 23.5% ] 23.31% | 399 | 71.2% |
[ 31.0% - 31.5% ] 31.25% | 16 | 100.0% |
[ 60.0% - 60.5% ] 60.00% | 25 | 40.0% |