Immigrants from Chile Married-couple Households

COMPARE

Immigrants from Chile
Race
Ancestry
AfghanAfricanAlaska NativeAlaskan AthabascanAlbanianAleutAlsatianAmericanApacheArabArapahoArgentineanArmenianAssyrian/Chaldean/SyriacAustralianAustrianBahamianBangladeshiBarbadianBasqueBelgianBelizeanBermudanBhutaneseBlackfeetBolivianBrazilianBritishBritish West IndianBulgarianBurmeseCajunCambodianCanadianCape VerdeanCarpatho RusynCelticCentral AmericanCentral American IndianCherokeeCheyenneChickasawChileanChineseChippewaChoctawColombianColvilleComancheCosta RicanCreeCreekCroatianCrowCubanCypriotCzechCzechoslovakianDanishDelawareDominicanDutchDutch West IndianEastern EuropeanEcuadorianEgyptianEnglishEstonianEthiopianEuropeanFijianFilipinoFinnishFrenchFrench American IndianFrench CanadianGermanGerman RussianGhanaianGreekGuamanian/ChamorroGuatemalanGuyaneseHaitianHmongHonduranHopiHoumaHungarianIcelanderIndian (Asian)IndonesianInupiatIranianIraqiIrishIroquoisIsraeliItalianJamaicanJapaneseJordanianKenyanKiowaKoreanLaotianLatvianLebaneseLiberianLithuanianLumbeeLuxembourgerMacedonianMalaysianMalteseMarshalleseMenomineeMexicanMexican American IndianMongolianMoroccanNative HawaiianNavajoNepaleseNew ZealanderNicaraguanNigerianNorthern EuropeanNorwegianOkinawanOsageOttawaPaiutePakistaniPalestinianPanamanianParaguayanPennsylvania GermanPeruvianPimaPolishPortuguesePotawatomiPuebloPuerto RicanPuget Sound SalishRomanianRussianSalvadoranSamoanScandinavianScotch-IrishScottishSeminoleSenegaleseSerbianShoshoneSierra LeoneanSiouxSlavicSlovakSloveneSomaliSouth AfricanSouth AmericanSouth American IndianSoviet UnionSpaniardSpanishSpanish AmericanSpanish American IndianSri LankanSubsaharan AfricanSudaneseSwedishSwissSyrianTaiwaneseThaiTlingit-HaidaTohono O'OdhamTonganTrinidadian and TobagonianTsimshianTurkishU.S. Virgin IslanderUgandanUkrainianUruguayanUteVenezuelanVietnameseWelshWest IndianYakamaYaquiYugoslavianYumanYup'ikZimbabwean
Immigration
NonimmigrantsImmigrantsAfghanistanAfricaAlbaniaArgentinaArmeniaAsiaAustraliaAustriaBahamasBangladeshBarbadosBelarusBelgiumBelizeBoliviaBosnia and HerzegovinaBrazilBulgariaBurma/MyanmarCabo VerdeCambodiaCameroonCanadaCaribbeanCentral AmericaChileChinaColombiaCongoCosta RicaCroatiaCubaCzechoslovakiaDenmarkDominicaDominican RepublicEastern AfricaEastern AsiaEastern EuropeEcuadorEgyptEl SalvadorEnglandEritreaEthiopiaEuropeFijiFranceGermanyGhanaGreeceGrenadaGuatemalaGuyanaHaitiHondurasHong KongHungaryIndiaIndonesiaIranIraqIrelandIsraelItalyJamaicaJapanJordanKazakhstanKenyaKoreaKuwaitLaosLatin AmericaLatviaLebanonLiberiaLithuaniaMalaysiaMexicoMicronesiaMiddle AfricaMoldovaMoroccoNepalNetherlandsNicaraguaNigeriaNorth AmericaNorth MacedoniaNorthern AfricaNorthern EuropeNorwayOceaniaPakistanPanamaPeruPhilippinesPolandPortugalRomaniaRussiaSaudi ArabiaScotlandSenegalSerbiaSierra LeoneSingaporeSomaliaSouth AfricaSouth AmericaSouth Central AsiaSouth Eastern AsiaSouthern EuropeSpainSri LankaSt. Vincent and the GrenadinesSudanSwedenSwitzerlandSyriaTaiwanThailandTrinidad and TobagoTurkeyUgandaUkraineUruguayUzbekistanVenezuelaVietnamWest IndiesWestern AfricaWestern AsiaWestern EuropeYemenZaireZimbabweAzores
Select to Compare
Race
Ancestry
AfghanAfricanAlaska NativeAlaskan AthabascanAlbanianAleutAlsatianAmericanApacheArabArapahoArgentineanArmenianAssyrian/Chaldean/SyriacAustralianAustrianBahamianBangladeshiBarbadianBasqueBelgianBelizeanBermudanBhutaneseBlackfeetBolivianBrazilianBritishBritish West IndianBulgarianBurmeseCajunCambodianCanadianCape VerdeanCarpatho RusynCelticCentral AmericanCentral American IndianCherokeeCheyenneChickasawChileanChineseChippewaChoctawColombianColvilleComancheCosta RicanCreeCreekCroatianCrowCubanCypriotCzechCzechoslovakianDanishDelawareDominicanDutchDutch West IndianEastern EuropeanEcuadorianEgyptianEnglishEstonianEthiopianEuropeanFijianFilipinoFinnishFrenchFrench American IndianFrench CanadianGermanGerman RussianGhanaianGreekGuamanian/ChamorroGuatemalanGuyaneseHaitianHmongHonduranHopiHoumaHungarianIcelanderIndian (Asian)IndonesianInupiatIranianIraqiIrishIroquoisIsraeliItalianJamaicanJapaneseJordanianKenyanKiowaKoreanLaotianLatvianLebaneseLiberianLithuanianLumbeeLuxembourgerMacedonianMalaysianMalteseMarshalleseMenomineeMexicanMexican American IndianMongolianMoroccanNative HawaiianNavajoNepaleseNew ZealanderNicaraguanNigerianNorthern EuropeanNorwegianOkinawanOsageOttawaPaiutePakistaniPalestinianPanamanianParaguayanPennsylvania GermanPeruvianPimaPolishPortuguesePotawatomiPuebloPuerto RicanPuget Sound SalishRomanianRussianSalvadoranSamoanScandinavianScotch-IrishScottishSeminoleSenegaleseSerbianShoshoneSierra LeoneanSiouxSlavicSlovakSloveneSomaliSouth AfricanSouth AmericanSouth American IndianSoviet UnionSpaniardSpanishSpanish AmericanSpanish American IndianSri LankanSubsaharan AfricanSudaneseSwedishSwissSyrianTaiwaneseThaiTlingit-HaidaTohono O'OdhamTonganTrinidadian and TobagonianTsimshianTurkishU.S. Virgin IslanderUgandanUkrainianUruguayanUteVenezuelanVietnameseWelshWest IndianYakamaYaquiYugoslavianYumanYup'ikZimbabwean
Immigration
NonimmigrantsImmigrantsAfghanistanAfricaAlbaniaArgentinaArmeniaAsiaAustraliaAustriaBahamasBangladeshBarbadosBelarusBelgiumBelizeBoliviaBosnia and HerzegovinaBrazilBulgariaBurma/MyanmarCabo VerdeCambodiaCameroonCanadaCaribbeanCentral AmericaChinaColombiaCongoCosta RicaCroatiaCubaCzechoslovakiaDenmarkDominicaDominican RepublicEastern AfricaEastern AsiaEastern EuropeEcuadorEgyptEl SalvadorEnglandEritreaEthiopiaEuropeFijiFranceGermanyGhanaGreeceGrenadaGuatemalaGuyanaHaitiHondurasHong KongHungaryIndiaIndonesiaIranIraqIrelandIsraelItalyJamaicaJapanJordanKazakhstanKenyaKoreaKuwaitLaosLatin AmericaLatviaLebanonLiberiaLithuaniaMalaysiaMexicoMicronesiaMiddle AfricaMoldovaMoroccoNepalNetherlandsNicaraguaNigeriaNorth AmericaNorth MacedoniaNorthern AfricaNorthern EuropeNorwayOceaniaPakistanPanamaPeruPhilippinesPolandPortugalRomaniaRussiaSaudi ArabiaScotlandSenegalSerbiaSierra LeoneSingaporeSomaliaSouth AfricaSouth AmericaSouth Central AsiaSouth Eastern AsiaSouthern EuropeSpainSri LankaSt. Vincent and the GrenadinesSudanSwedenSwitzerlandSyriaTaiwanThailandTrinidad and TobagoTurkeyUgandaUkraineUruguayUzbekistanVenezuelaVietnamWest IndiesWestern AfricaWestern AsiaWestern EuropeYemenZaireZimbabweAzores
Married-couple Households
Income
Poverty
Unemployment
Labor Participation
Family Structure
Vehicle Availability
Education Level
Disability

Immigrants from Chile Married-couple Households
Average

46.5%
MARRIED-COUPLE HOUSEHOLDS
55.7/ 100
METRIC RATING
171st/ 347
METRIC RANK

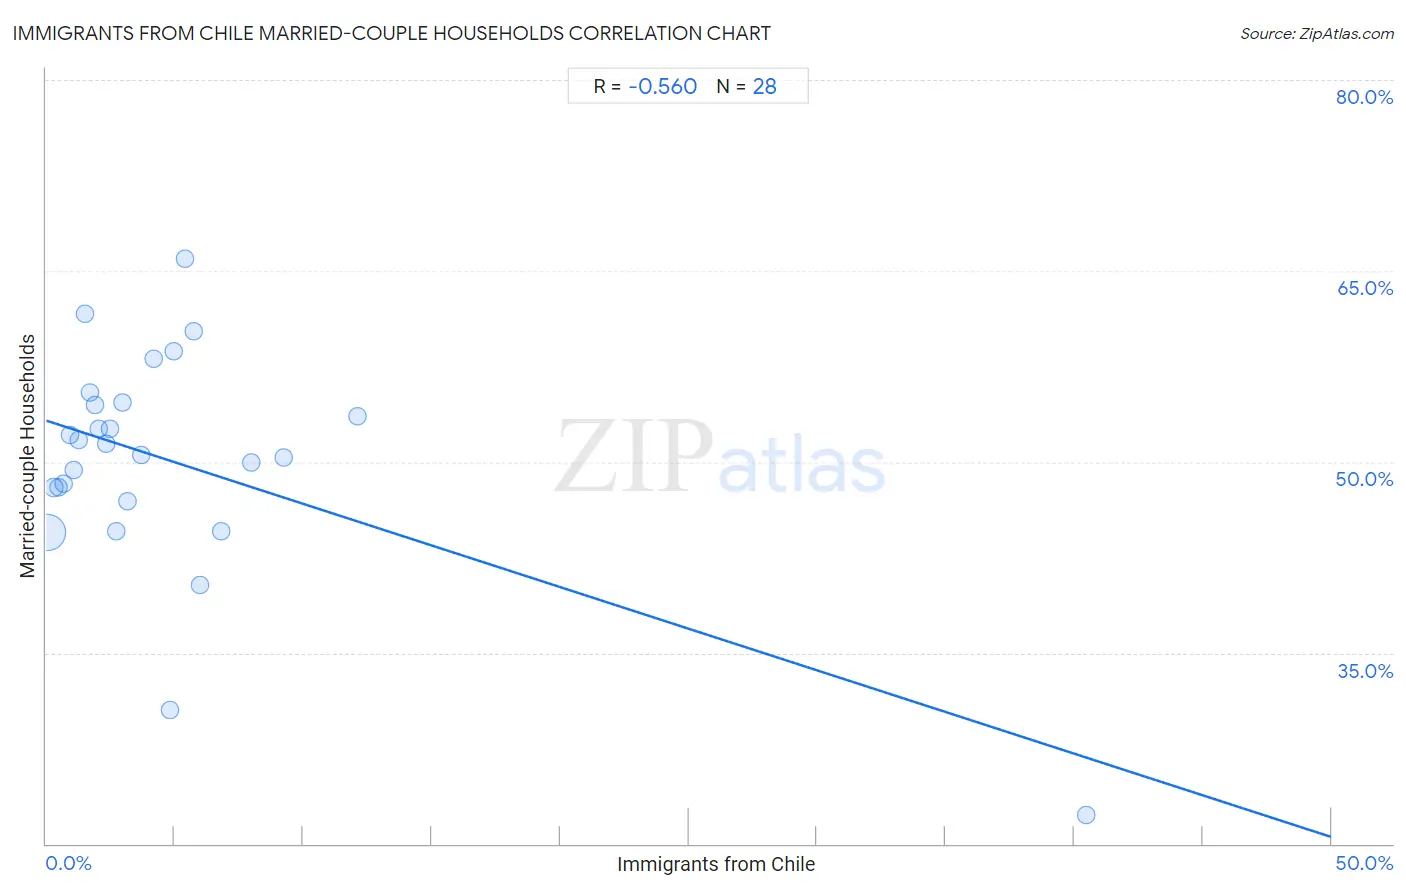
Immigrants from Chile Married-couple Households Correlation Chart

The statistical analysis conducted on geographies consisting of 218,594,724 people shows a substantial negative correlation between the proportion of Immigrants from Chile and percentage of married-couple family households in the United States with a correlation coefficient (R) of -0.560 and weighted average of 46.5%. On average, for every 1% (one percent) increase in Immigrants from Chile within a typical geography, there is a decrease of 0.65% in percentage of married-couple family households.
Immigrants from Chile Married-couple Households
It is essential to understand that the correlation between the percentage of Immigrants from Chile and percentage of married-couple family households does not imply a direct cause-and-effect relationship. It remains uncertain whether the presence of Immigrants from Chile influences an upward or downward trend in the level of percentage of married-couple family households within an area, or if Immigrants from Chile simply ended up residing in those areas with higher or lower levels of percentage of married-couple family households due to other factors.

Demographics Similar to Immigrants from Chile by Married-couple Households

In terms of married-couple households, the demographic groups most similar to Immigrants from Chile are Immigrants from Australia (46.5%, a difference of 0.040%), South American (46.6%, a difference of 0.090%), Spanish American Indian (46.6%, a difference of 0.14%), Immigrants from Norway (46.5%, a difference of 0.14%), and Immigrants from Mexico (46.4%, a difference of 0.22%).
DemographicsRating | RankMarried-couple Households
Immigrants from Kazakhstan
70.0
/100
|
#164
Good
46.8%
Immigrants from Southern Europe
69.9
/100
|
#165
Good
46.8%
Cherokee
65.7
/100
|
#166
Good
46.7%
Immigrants from Croatia
64.2
/100
|
#167
Good
46.7%
Israelis
62.3
/100
|
#168
Good
46.7%
Spanish American Indians
59.4
/100
|
#169
Average
46.6%
South Americans
58.0
/100
|
#170
Average
46.6%
Immigrants from Chile
55.7
/100
|
#171
Average
46.5%
Immigrants from Australia
54.6
/100
|
#172
Average
46.5%
Immigrants from Norway
52.0
/100
|
#173
Average
46.5%
Immigrants from Mexico
50.0
/100
|
#174
Average
46.4%
Immigrants from Colombia
46.1
/100
|
#175
Average
46.4%
Cajuns
45.2
/100
|
#176
Average
46.4%
Immigrants
43.8
/100
|
#177
Average
46.3%
Immigrants from Costa Rica
43.4
/100
|
#178
Average
46.3%

Immigrants from Chile Married-couple Households Correlation Summary

MeasurementImmigrants from Chile DataMarried-couple Households Data
Minimum0.054%22.2%
Maximum40.5%65.9%
Range40.4%43.7%
Mean4.9%50.0%
Median2.8%51.0%
Interquartile 25% (IQ1)1.4%47.4%
Interquartile 75% (IQ3)5.6%54.6%
Interquartile Range (IQR)4.2%7.2%
Standard Deviation (Sample)7.6%8.8%
Standard Deviation (Population)7.4%8.7%

Correlation Details

Immigrants from Chile PercentileSample SizeMarried-couple Households
[
0.0%
-
0.5%
]
0.054%
197,825,64144.4%
[
0.0%
-
0.5%
]
0.28%
13,497,46448.0%
[
0.0%
-
0.5%
]
0.49%
4,077,24648.0%
[
0.5%
-
1.0%
]
0.70%
1,431,66448.3%
[
0.5%
-
1.0%
]
0.90%
657,24352.1%
[
1.0%
-
1.5%
]
1.08%
554,04749.4%
[
1.0%
-
1.5%
]
1.29%
212,13651.7%
[
1.5%
-
2.0%
]
1.53%
60,62061.6%
[
1.5%
-
2.0%
]
1.71%
63,90555.4%
[
1.5%
-
2.0%
]
1.92%
54,87654.5%
[
2.0%
-
2.5%
]
2.06%
47,43552.6%
[
2.0%
-
2.5%
]
2.32%
17,78451.5%
[
2.0%
-
2.5%
]
2.49%
28,07252.6%
[
2.5%
-
3.0%
]
2.71%
9,93844.6%
[
2.5%
-
3.0%
]
2.95%
20,97154.7%
[
3.0%
-
3.5%
]
3.18%
5,12846.9%
[
3.5%
-
4.0%
]
3.69%
5,86150.5%
[
4.0%
-
4.5%
]
4.16%
1,80158.1%
[
4.5%
-
5.0%
]
4.81%
18730.5%
[
4.5%
-
5.0%
]
4.97%
8,45058.7%
[
5.0%
-
5.5%
]
5.40%
53765.9%
[
5.5%
-
6.0%
]
5.75%
7,30760.3%
[
5.5%
-
6.0%
]
5.98%
2,19240.3%
[
6.5%
-
7.0%
]
6.83%
73244.6%
[
7.5%
-
8.0%
]
7.95%
1,62249.9%
[
9.0%
-
9.5%
]
9.24%
86650.3%
[
12.0%
-
12.5%
]
12.12%
95753.6%
[
40.0%
-
40.5%
]
40.48%
4222.2%