Immigrants from Chile GED/Equivalency

COMPARE

Immigrants from Chile
Race
Ancestry
AfghanAfricanAlaska NativeAlaskan AthabascanAlbanianAleutAlsatianAmericanApacheArabArapahoArgentineanArmenianAssyrian/Chaldean/SyriacAustralianAustrianBahamianBangladeshiBarbadianBasqueBelgianBelizeanBermudanBhutaneseBlackfeetBolivianBrazilianBritishBritish West IndianBulgarianBurmeseCajunCambodianCanadianCape VerdeanCarpatho RusynCelticCentral AmericanCentral American IndianCherokeeCheyenneChickasawChileanChineseChippewaChoctawColombianColvilleComancheCosta RicanCreeCreekCroatianCrowCubanCypriotCzechCzechoslovakianDanishDelawareDominicanDutchDutch West IndianEastern EuropeanEcuadorianEgyptianEnglishEstonianEthiopianEuropeanFijianFilipinoFinnishFrenchFrench American IndianFrench CanadianGermanGerman RussianGhanaianGreekGuamanian/ChamorroGuatemalanGuyaneseHaitianHmongHonduranHopiHoumaHungarianIcelanderIndian (Asian)IndonesianInupiatIranianIraqiIrishIroquoisIsraeliItalianJamaicanJapaneseJordanianKenyanKiowaKoreanLaotianLatvianLebaneseLiberianLithuanianLumbeeLuxembourgerMacedonianMalaysianMalteseMarshalleseMenomineeMexicanMexican American IndianMongolianMoroccanNative HawaiianNavajoNepaleseNew ZealanderNicaraguanNigerianNorthern EuropeanNorwegianOkinawanOsageOttawaPaiutePakistaniPalestinianPanamanianParaguayanPennsylvania GermanPeruvianPimaPolishPortuguesePotawatomiPuebloPuerto RicanPuget Sound SalishRomanianRussianSalvadoranSamoanScandinavianScotch-IrishScottishSeminoleSenegaleseSerbianShoshoneSierra LeoneanSiouxSlavicSlovakSloveneSomaliSouth AfricanSouth AmericanSouth American IndianSoviet UnionSpaniardSpanishSpanish AmericanSpanish American IndianSri LankanSubsaharan AfricanSudaneseSwedishSwissSyrianTaiwaneseThaiTlingit-HaidaTohono O'OdhamTonganTrinidadian and TobagonianTsimshianTurkishU.S. Virgin IslanderUgandanUkrainianUruguayanUteVenezuelanVietnameseWelshWest IndianYakamaYaquiYugoslavianYumanYup'ikZimbabwean
Immigration
NonimmigrantsImmigrantsAfghanistanAfricaAlbaniaArgentinaArmeniaAsiaAustraliaAustriaBahamasBangladeshBarbadosBelarusBelgiumBelizeBoliviaBosnia and HerzegovinaBrazilBulgariaBurma/MyanmarCabo VerdeCambodiaCameroonCanadaCaribbeanCentral AmericaChileChinaColombiaCongoCosta RicaCroatiaCubaCzechoslovakiaDenmarkDominicaDominican RepublicEastern AfricaEastern AsiaEastern EuropeEcuadorEgyptEl SalvadorEnglandEritreaEthiopiaEuropeFijiFranceGermanyGhanaGreeceGrenadaGuatemalaGuyanaHaitiHondurasHong KongHungaryIndiaIndonesiaIranIraqIrelandIsraelItalyJamaicaJapanJordanKazakhstanKenyaKoreaKuwaitLaosLatin AmericaLatviaLebanonLiberiaLithuaniaMalaysiaMexicoMicronesiaMiddle AfricaMoldovaMoroccoNepalNetherlandsNicaraguaNigeriaNorth AmericaNorth MacedoniaNorthern AfricaNorthern EuropeNorwayOceaniaPakistanPanamaPeruPhilippinesPolandPortugalRomaniaRussiaSaudi ArabiaScotlandSenegalSerbiaSierra LeoneSingaporeSomaliaSouth AfricaSouth AmericaSouth Central AsiaSouth Eastern AsiaSouthern EuropeSpainSri LankaSt. Vincent and the GrenadinesSudanSwedenSwitzerlandSyriaTaiwanThailandTrinidad and TobagoTurkeyUgandaUkraineUruguayUzbekistanVenezuelaVietnamWest IndiesWestern AfricaWestern AsiaWestern EuropeYemenZaireZimbabweAzores
Select to Compare
Race
Ancestry
AfghanAfricanAlaska NativeAlaskan AthabascanAlbanianAleutAlsatianAmericanApacheArabArapahoArgentineanArmenianAssyrian/Chaldean/SyriacAustralianAustrianBahamianBangladeshiBarbadianBasqueBelgianBelizeanBermudanBhutaneseBlackfeetBolivianBrazilianBritishBritish West IndianBulgarianBurmeseCajunCambodianCanadianCape VerdeanCarpatho RusynCelticCentral AmericanCentral American IndianCherokeeCheyenneChickasawChileanChineseChippewaChoctawColombianColvilleComancheCosta RicanCreeCreekCroatianCrowCubanCypriotCzechCzechoslovakianDanishDelawareDominicanDutchDutch West IndianEastern EuropeanEcuadorianEgyptianEnglishEstonianEthiopianEuropeanFijianFilipinoFinnishFrenchFrench American IndianFrench CanadianGermanGerman RussianGhanaianGreekGuamanian/ChamorroGuatemalanGuyaneseHaitianHmongHonduranHopiHoumaHungarianIcelanderIndian (Asian)IndonesianInupiatIranianIraqiIrishIroquoisIsraeliItalianJamaicanJapaneseJordanianKenyanKiowaKoreanLaotianLatvianLebaneseLiberianLithuanianLumbeeLuxembourgerMacedonianMalaysianMalteseMarshalleseMenomineeMexicanMexican American IndianMongolianMoroccanNative HawaiianNavajoNepaleseNew ZealanderNicaraguanNigerianNorthern EuropeanNorwegianOkinawanOsageOttawaPaiutePakistaniPalestinianPanamanianParaguayanPennsylvania GermanPeruvianPimaPolishPortuguesePotawatomiPuebloPuerto RicanPuget Sound SalishRomanianRussianSalvadoranSamoanScandinavianScotch-IrishScottishSeminoleSenegaleseSerbianShoshoneSierra LeoneanSiouxSlavicSlovakSloveneSomaliSouth AfricanSouth AmericanSouth American IndianSoviet UnionSpaniardSpanishSpanish AmericanSpanish American IndianSri LankanSubsaharan AfricanSudaneseSwedishSwissSyrianTaiwaneseThaiTlingit-HaidaTohono O'OdhamTonganTrinidadian and TobagonianTsimshianTurkishU.S. Virgin IslanderUgandanUkrainianUruguayanUteVenezuelanVietnameseWelshWest IndianYakamaYaquiYugoslavianYumanYup'ikZimbabwean
Immigration
NonimmigrantsImmigrantsAfghanistanAfricaAlbaniaArgentinaArmeniaAsiaAustraliaAustriaBahamasBangladeshBarbadosBelarusBelgiumBelizeBoliviaBosnia and HerzegovinaBrazilBulgariaBurma/MyanmarCabo VerdeCambodiaCameroonCanadaCaribbeanCentral AmericaChinaColombiaCongoCosta RicaCroatiaCubaCzechoslovakiaDenmarkDominicaDominican RepublicEastern AfricaEastern AsiaEastern EuropeEcuadorEgyptEl SalvadorEnglandEritreaEthiopiaEuropeFijiFranceGermanyGhanaGreeceGrenadaGuatemalaGuyanaHaitiHondurasHong KongHungaryIndiaIndonesiaIranIraqIrelandIsraelItalyJamaicaJapanJordanKazakhstanKenyaKoreaKuwaitLaosLatin AmericaLatviaLebanonLiberiaLithuaniaMalaysiaMexicoMicronesiaMiddle AfricaMoldovaMoroccoNepalNetherlandsNicaraguaNigeriaNorth AmericaNorth MacedoniaNorthern AfricaNorthern EuropeNorwayOceaniaPakistanPanamaPeruPhilippinesPolandPortugalRomaniaRussiaSaudi ArabiaScotlandSenegalSerbiaSierra LeoneSingaporeSomaliaSouth AfricaSouth AmericaSouth Central AsiaSouth Eastern AsiaSouthern EuropeSpainSri LankaSt. Vincent and the GrenadinesSudanSwedenSwitzerlandSyriaTaiwanThailandTrinidad and TobagoTurkeyUgandaUkraineUruguayUzbekistanVenezuelaVietnamWest IndiesWestern AfricaWestern AsiaWestern EuropeYemenZaireZimbabweAzores
GED/Equivalency
Income
Poverty
Unemployment
Labor Participation
Family Structure
Vehicle Availability
Education Level
Disability

Immigrants from Chile GED/Equivalency
Average

85.9%
GED/EQUIVALENCY
57.3/ 100
METRIC RATING
171st/ 347
METRIC RANK

Immigrants from Chile GED/Equivalency Correlation Chart

The statistical analysis conducted on geographies consisting of 218,647,266 people shows a mild negative correlation between the proportion of Immigrants from Chile and percentage of population with at least ged/equivalency education in the United States with a correlation coefficient (R) of -0.393 and weighted average of 85.9%. On average, for every 1% (one percent) increase in Immigrants from Chile within a typical geography, there is a decrease of 0.45% in percentage of population with at least ged/equivalency education.
Immigrants from Chile GED/Equivalency
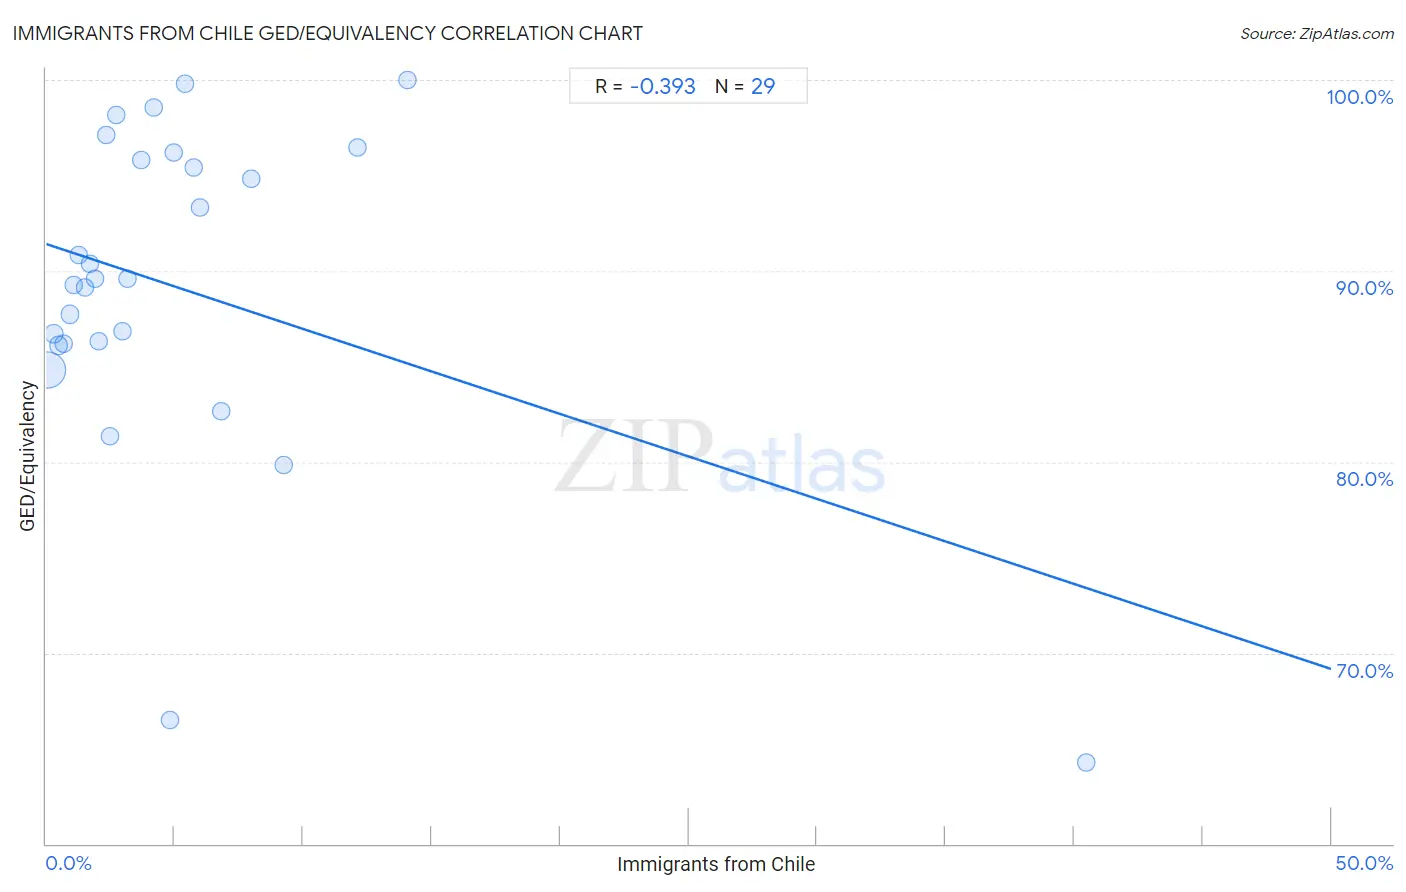
It is essential to understand that the correlation between the percentage of Immigrants from Chile and percentage of population with at least ged/equivalency education does not imply a direct cause-and-effect relationship. It remains uncertain whether the presence of Immigrants from Chile influences an upward or downward trend in the level of percentage of population with at least ged/equivalency education within an area, or if Immigrants from Chile simply ended up residing in those areas with higher or lower levels of percentage of population with at least ged/equivalency education due to other factors.

Demographics Similar to Immigrants from Chile by GED/Equivalency

In terms of ged/equivalency, the demographic groups most similar to Immigrants from Chile are Afghan (85.9%, a difference of 0.050%), Bermudan (85.8%, a difference of 0.050%), Immigrants from Ethiopia (86.0%, a difference of 0.080%), Sierra Leonean (86.0%, a difference of 0.10%), and Ethiopian (86.0%, a difference of 0.14%).
DemographicsRating | RankGED/Equivalency
Venezuelans
65.5
/100
|
#164
Good
86.0%
Alsatians
64.3
/100
|
#165
Good
86.0%
Immigrants from Albania
64.2
/100
|
#166
Good
86.0%
Ethiopians
63.7
/100
|
#167
Good
86.0%
Sierra Leoneans
61.8
/100
|
#168
Good
86.0%
Immigrants from Ethiopia
61.2
/100
|
#169
Good
86.0%
Afghans
59.7
/100
|
#170
Average
85.9%
Immigrants from Chile
57.3
/100
|
#171
Average
85.9%
Bermudans
55.1
/100
|
#172
Average
85.8%
Immigrants from Venezuela
50.7
/100
|
#173
Average
85.8%
Ottawa
50.0
/100
|
#174
Average
85.8%
Immigrants from Bolivia
49.8
/100
|
#175
Average
85.8%
Immigrants from Eastern Africa
47.7
/100
|
#176
Average
85.7%
Immigrants from Uganda
45.2
/100
|
#177
Average
85.7%
Koreans
41.2
/100
|
#178
Average
85.6%

Immigrants from Chile GED/Equivalency Correlation Summary

MeasurementImmigrants from Chile DataGED/Equivalency Data
Minimum0.054%64.3%
Maximum40.5%100.0%
Range40.4%35.7%
Mean5.2%89.1%
Median3.0%89.6%
Interquartile 25% (IQ1)1.4%86.1%
Interquartile 75% (IQ3)5.9%96.0%
Interquartile Range (IQR)4.5%9.8%
Standard Deviation (Sample)7.6%8.6%
Standard Deviation (Population)7.5%8.5%

Correlation Details

Immigrants from Chile PercentileSample SizeGED/Equivalency
[
0.0%
-
0.5%
]
0.054%
197,863,04284.8%
[
0.0%
-
0.5%
]
0.28%
13,511,54086.7%
[
0.0%
-
0.5%
]
0.49%
4,077,24686.1%
[
0.5%
-
1.0%
]
0.70%
1,432,14486.2%
[
0.5%
-
1.0%
]
0.90%
657,24387.7%
[
1.0%
-
1.5%
]
1.08%
554,04789.3%
[
1.0%
-
1.5%
]
1.29%
212,13690.9%
[
1.5%
-
2.0%
]
1.53%
60,62089.1%
[
1.5%
-
2.0%
]
1.71%
63,90590.4%
[
1.5%
-
2.0%
]
1.92%
55,39789.6%
[
2.0%
-
2.5%
]
2.06%
47,43586.3%
[
2.0%
-
2.5%
]
2.32%
17,78497.1%
[
2.0%
-
2.5%
]
2.49%
28,07281.3%
[
2.5%
-
3.0%
]
2.71%
9,93898.2%
[
2.5%
-
3.0%
]
2.95%
20,97186.8%
[
3.0%
-
3.5%
]
3.18%
5,12889.6%
[
3.5%
-
4.0%
]
3.69%
5,86195.8%
[
4.0%
-
4.5%
]
4.16%
1,80198.6%
[
4.5%
-
5.0%
]
4.81%
18766.5%
[
4.5%
-
5.0%
]
4.97%
8,45096.2%
[
5.0%
-
5.5%
]
5.40%
53799.8%
[
5.5%
-
6.0%
]
5.75%
7,30795.4%
[
5.5%
-
6.0%
]
5.98%
2,19293.3%
[
6.5%
-
7.0%
]
6.83%
73282.6%
[
7.5%
-
8.0%
]
7.95%
1,62294.8%
[
9.0%
-
9.5%
]
9.24%
86679.9%
[
12.0%
-
12.5%
]
12.12%
95796.4%
[
14.0%
-
14.5%
]
14.06%
64100.0%
[
40.0%
-
40.5%
]
40.48%
4264.3%