Immigrants from Canada 2 or more Vehicles in Household

COMPARE

Immigrants from Canada
Race
Ancestry
AfghanAfricanAlaska NativeAlaskan AthabascanAlbanianAleutAlsatianAmericanApacheArabArapahoArgentineanArmenianAssyrian/Chaldean/SyriacAustralianAustrianBahamianBangladeshiBarbadianBasqueBelgianBelizeanBermudanBhutaneseBlackfeetBolivianBrazilianBritishBritish West IndianBulgarianBurmeseCajunCambodianCanadianCape VerdeanCarpatho RusynCelticCentral AmericanCentral American IndianCherokeeCheyenneChickasawChileanChineseChippewaChoctawColombianColvilleComancheCosta RicanCreeCreekCroatianCrowCubanCypriotCzechCzechoslovakianDanishDelawareDominicanDutchDutch West IndianEastern EuropeanEcuadorianEgyptianEnglishEstonianEthiopianEuropeanFijianFilipinoFinnishFrenchFrench American IndianFrench CanadianGermanGerman RussianGhanaianGreekGuamanian/ChamorroGuatemalanGuyaneseHaitianHmongHonduranHopiHoumaHungarianIcelanderIndian (Asian)IndonesianInupiatIranianIraqiIrishIroquoisIsraeliItalianJamaicanJapaneseJordanianKenyanKiowaKoreanLaotianLatvianLebaneseLiberianLithuanianLumbeeLuxembourgerMacedonianMalaysianMalteseMarshalleseMenomineeMexicanMexican American IndianMongolianMoroccanNative HawaiianNavajoNepaleseNew ZealanderNicaraguanNigerianNorthern EuropeanNorwegianOkinawanOsageOttawaPaiutePakistaniPalestinianPanamanianParaguayanPennsylvania GermanPeruvianPimaPolishPortuguesePotawatomiPuebloPuerto RicanPuget Sound SalishRomanianRussianSalvadoranSamoanScandinavianScotch-IrishScottishSeminoleSenegaleseSerbianShoshoneSierra LeoneanSiouxSlavicSlovakSloveneSomaliSouth AfricanSouth AmericanSouth American IndianSoviet UnionSpaniardSpanishSpanish AmericanSpanish American IndianSri LankanSubsaharan AfricanSudaneseSwedishSwissSyrianTaiwaneseThaiTlingit-HaidaTohono O'OdhamTonganTrinidadian and TobagonianTsimshianTurkishU.S. Virgin IslanderUgandanUkrainianUruguayanUteVenezuelanVietnameseWelshWest IndianYakamaYaquiYugoslavianYumanYup'ikZimbabwean
Immigration
NonimmigrantsImmigrantsAfghanistanAfricaAlbaniaArgentinaArmeniaAsiaAustraliaAustriaBahamasBangladeshBarbadosBelarusBelgiumBelizeBoliviaBosnia and HerzegovinaBrazilBulgariaBurma/MyanmarCabo VerdeCambodiaCameroonCanadaCaribbeanCentral AmericaChileChinaColombiaCongoCosta RicaCroatiaCubaCzechoslovakiaDenmarkDominicaDominican RepublicEastern AfricaEastern AsiaEastern EuropeEcuadorEgyptEl SalvadorEnglandEritreaEthiopiaEuropeFijiFranceGermanyGhanaGreeceGrenadaGuatemalaGuyanaHaitiHondurasHong KongHungaryIndiaIndonesiaIranIraqIrelandIsraelItalyJamaicaJapanJordanKazakhstanKenyaKoreaKuwaitLaosLatin AmericaLatviaLebanonLiberiaLithuaniaMalaysiaMexicoMicronesiaMiddle AfricaMoldovaMoroccoNepalNetherlandsNicaraguaNigeriaNorth AmericaNorth MacedoniaNorthern AfricaNorthern EuropeNorwayOceaniaPakistanPanamaPeruPhilippinesPolandPortugalRomaniaRussiaSaudi ArabiaScotlandSenegalSerbiaSierra LeoneSingaporeSomaliaSouth AfricaSouth AmericaSouth Central AsiaSouth Eastern AsiaSouthern EuropeSpainSri LankaSt. Vincent and the GrenadinesSudanSwedenSwitzerlandSyriaTaiwanThailandTrinidad and TobagoTurkeyUgandaUkraineUruguayUzbekistanVenezuelaVietnamWest IndiesWestern AfricaWestern AsiaWestern EuropeYemenZaireZimbabweAzores
Select to Compare
Race
Ancestry
AfghanAfricanAlaska NativeAlaskan AthabascanAlbanianAleutAlsatianAmericanApacheArabArapahoArgentineanArmenianAssyrian/Chaldean/SyriacAustralianAustrianBahamianBangladeshiBarbadianBasqueBelgianBelizeanBermudanBhutaneseBlackfeetBolivianBrazilianBritishBritish West IndianBulgarianBurmeseCajunCambodianCanadianCape VerdeanCarpatho RusynCelticCentral AmericanCentral American IndianCherokeeCheyenneChickasawChileanChineseChippewaChoctawColombianColvilleComancheCosta RicanCreeCreekCroatianCrowCubanCypriotCzechCzechoslovakianDanishDelawareDominicanDutchDutch West IndianEastern EuropeanEcuadorianEgyptianEnglishEstonianEthiopianEuropeanFijianFilipinoFinnishFrenchFrench American IndianFrench CanadianGermanGerman RussianGhanaianGreekGuamanian/ChamorroGuatemalanGuyaneseHaitianHmongHonduranHopiHoumaHungarianIcelanderIndian (Asian)IndonesianInupiatIranianIraqiIrishIroquoisIsraeliItalianJamaicanJapaneseJordanianKenyanKiowaKoreanLaotianLatvianLebaneseLiberianLithuanianLumbeeLuxembourgerMacedonianMalaysianMalteseMarshalleseMenomineeMexicanMexican American IndianMongolianMoroccanNative HawaiianNavajoNepaleseNew ZealanderNicaraguanNigerianNorthern EuropeanNorwegianOkinawanOsageOttawaPaiutePakistaniPalestinianPanamanianParaguayanPennsylvania GermanPeruvianPimaPolishPortuguesePotawatomiPuebloPuerto RicanPuget Sound SalishRomanianRussianSalvadoranSamoanScandinavianScotch-IrishScottishSeminoleSenegaleseSerbianShoshoneSierra LeoneanSiouxSlavicSlovakSloveneSomaliSouth AfricanSouth AmericanSouth American IndianSoviet UnionSpaniardSpanishSpanish AmericanSpanish American IndianSri LankanSubsaharan AfricanSudaneseSwedishSwissSyrianTaiwaneseThaiTlingit-HaidaTohono O'OdhamTonganTrinidadian and TobagonianTsimshianTurkishU.S. Virgin IslanderUgandanUkrainianUruguayanUteVenezuelanVietnameseWelshWest IndianYakamaYaquiYugoslavianYumanYup'ikZimbabwean
Immigration
NonimmigrantsImmigrantsAfghanistanAfricaAlbaniaArgentinaArmeniaAsiaAustraliaAustriaBahamasBangladeshBarbadosBelarusBelgiumBelizeBoliviaBosnia and HerzegovinaBrazilBulgariaBurma/MyanmarCabo VerdeCambodiaCameroonCaribbeanCentral AmericaChileChinaColombiaCongoCosta RicaCroatiaCubaCzechoslovakiaDenmarkDominicaDominican RepublicEastern AfricaEastern AsiaEastern EuropeEcuadorEgyptEl SalvadorEnglandEritreaEthiopiaEuropeFijiFranceGermanyGhanaGreeceGrenadaGuatemalaGuyanaHaitiHondurasHong KongHungaryIndiaIndonesiaIranIraqIrelandIsraelItalyJamaicaJapanJordanKazakhstanKenyaKoreaKuwaitLaosLatin AmericaLatviaLebanonLiberiaLithuaniaMalaysiaMexicoMicronesiaMiddle AfricaMoldovaMoroccoNepalNetherlandsNicaraguaNigeriaNorth AmericaNorth MacedoniaNorthern AfricaNorthern EuropeNorwayOceaniaPakistanPanamaPeruPhilippinesPolandPortugalRomaniaRussiaSaudi ArabiaScotlandSenegalSerbiaSierra LeoneSingaporeSomaliaSouth AfricaSouth AmericaSouth Central AsiaSouth Eastern AsiaSouthern EuropeSpainSri LankaSt. Vincent and the GrenadinesSudanSwedenSwitzerlandSyriaTaiwanThailandTrinidad and TobagoTurkeyUgandaUkraineUruguayUzbekistanVenezuelaVietnamWest IndiesWestern AfricaWestern AsiaWestern EuropeYemenZaireZimbabweAzores
2 or more Vehicles in Household
Income
Poverty
Unemployment
Labor Participation
Family Structure
Vehicle Availability
Education Level
Disability

Immigrants from Canada 2 or more Vehicles in Household
Exceptional

57.5%
2+ VEHICLES AVAILABLE
98.1/ 100
METRIC RATING
108th/ 347
METRIC RANK

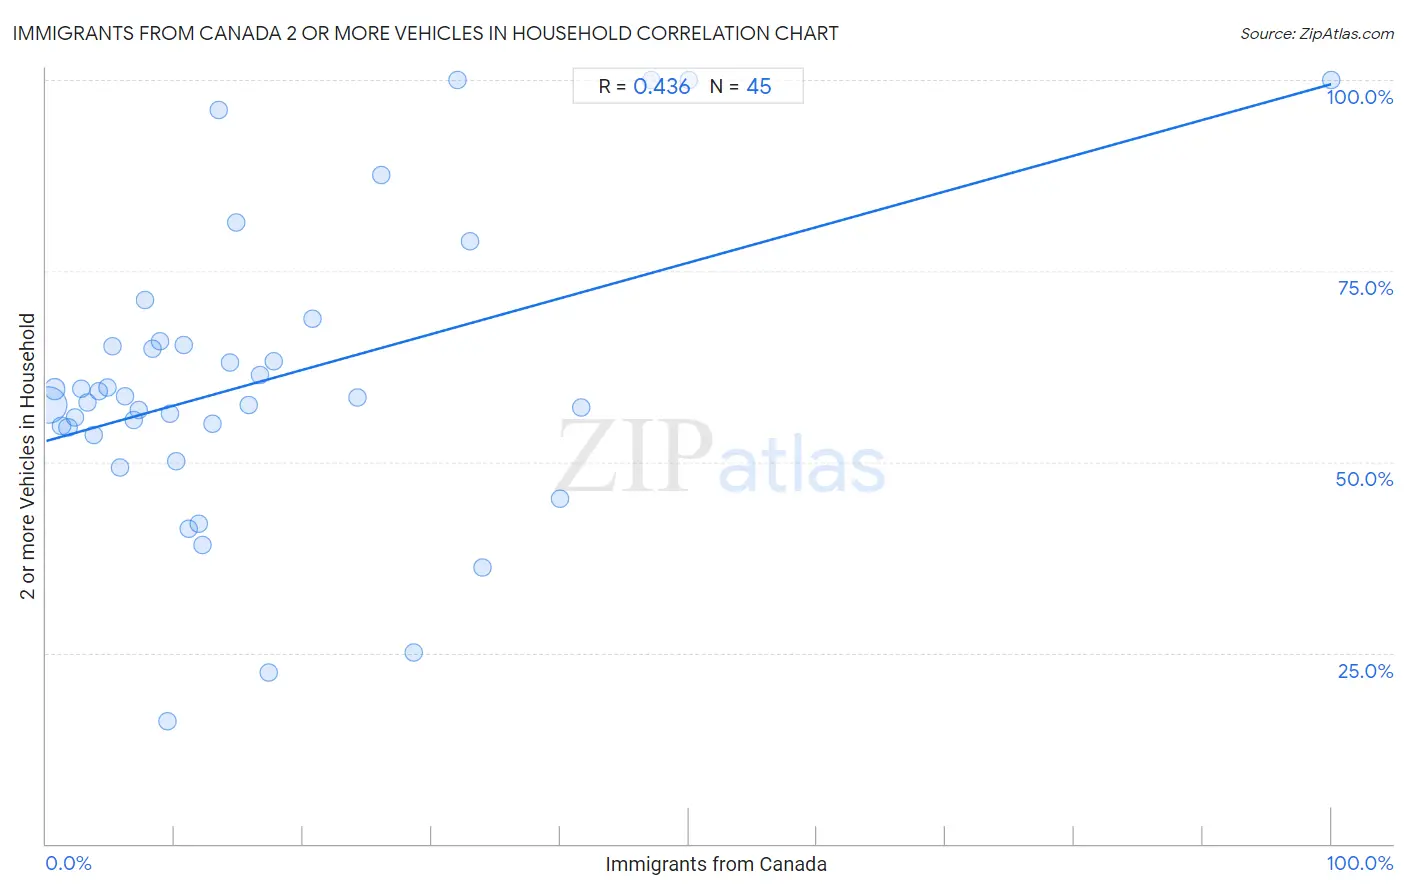
Immigrants from Canada 2 or more Vehicles in Household Correlation Chart

The statistical analysis conducted on geographies consisting of 459,158,975 people shows a moderate positive correlation between the proportion of Immigrants from Canada and percentage of households with 2 or more vehicles available in the United States with a correlation coefficient (R) of 0.436 and weighted average of 57.5%. On average, for every 1% (one percent) increase in Immigrants from Canada within a typical geography, there is an increase of 0.47% in percentage of households with 2 or more vehicles available.
Immigrants from Canada 2 or more Vehicles in Household
It is essential to understand that the correlation between the percentage of Immigrants from Canada and percentage of households with 2 or more vehicles available does not imply a direct cause-and-effect relationship. It remains uncertain whether the presence of Immigrants from Canada influences an upward or downward trend in the level of percentage of households with 2 or more vehicles available within an area, or if Immigrants from Canada simply ended up residing in those areas with higher or lower levels of percentage of households with 2 or more vehicles available due to other factors.

Demographics Similar to Immigrants from Canada by 2 or more Vehicles in Household

In terms of 2 or more vehicles in household, the demographic groups most similar to Immigrants from Canada are Immigrants from Netherlands (57.5%, a difference of 0.010%), Immigrants from Oceania (57.5%, a difference of 0.030%), Immigrants from North America (57.5%, a difference of 0.030%), Immigrants from Bolivia (57.6%, a difference of 0.050%), and Jordanian (57.6%, a difference of 0.050%).
DemographicsRating | Rank2 or more Vehicles in Household
Lebanese
98.3
/100
|
#101
Exceptional
57.6%
Immigrants from Bolivia
98.2
/100
|
#102
Exceptional
57.6%
Jordanians
98.2
/100
|
#103
Exceptional
57.6%
Immigrants from Indonesia
98.2
/100
|
#104
Exceptional
57.6%
Immigrants from Korea
98.2
/100
|
#105
Exceptional
57.6%
Immigrants from Oceania
98.2
/100
|
#106
Exceptional
57.5%
Immigrants from Netherlands
98.2
/100
|
#107
Exceptional
57.5%
Immigrants from Canada
98.1
/100
|
#108
Exceptional
57.5%
Immigrants from North America
98.1
/100
|
#109
Exceptional
57.5%
Japanese
98.0
/100
|
#110
Exceptional
57.5%
Greeks
98.0
/100
|
#111
Exceptional
57.5%
Pueblo
98.0
/100
|
#112
Exceptional
57.5%
Zimbabweans
96.9
/100
|
#113
Exceptional
57.2%
Immigrants from Lebanon
96.8
/100
|
#114
Exceptional
57.2%
Chippewa
96.6
/100
|
#115
Exceptional
57.2%

Immigrants from Canada 2 or more Vehicles in Household Correlation Summary

MeasurementImmigrants from Canada Data2 or more Vehicles in Household Data
Minimum0.19%16.0%
Maximum100.0%100.0%
Range99.8%84.0%
Mean16.8%60.6%
Median11.1%58.4%
Interquartile 25% (IQ1)5.5%54.1%
Interquartile 75% (IQ3)22.5%65.5%
Interquartile Range (IQR)17.0%11.4%
Standard Deviation (Sample)18.1%19.4%
Standard Deviation (Population)17.9%19.1%

Correlation Details

Immigrants from Canada PercentileSample Size2 or more Vehicles in Household
[
0.0%
-
0.5%
]
0.19%
377,665,55257.4%
[
0.5%
-
1.0%
]
0.68%
60,329,11159.5%
[
1.0%
-
1.5%
]
1.19%
13,641,61754.7%
[
1.5%
-
2.0%
]
1.69%
4,607,25354.6%
[
2.0%
-
2.5%
]
2.21%
1,479,20455.8%
[
2.5%
-
3.0%
]
2.72%
665,64559.6%
[
3.0%
-
3.5%
]
3.22%
216,26657.8%
[
3.5%
-
4.0%
]
3.69%
135,89453.6%
[
4.0%
-
4.5%
]
4.13%
157,88159.2%
[
4.5%
-
5.0%
]
4.75%
55,98459.7%
[
5.0%
-
5.5%
]
5.16%
40,05365.2%
[
5.5%
-
6.0%
]
5.76%
20,38949.2%
[
6.0%
-
6.5%
]
6.15%
33,41458.5%
[
6.5%
-
7.0%
]
6.82%
17,15755.5%
[
7.0%
-
7.5%
]
7.20%
32,52056.9%
[
7.5%
-
8.0%
]
7.67%
14,90771.2%
[
8.0%
-
8.5%
]
8.25%
2,11064.8%
[
8.5%
-
9.0%
]
8.82%
5,59265.8%
[
9.0%
-
9.5%
]
9.44%
6,89916.0%
[
9.5%
-
10.0%
]
9.59%
2,38756.3%
[
10.0%
-
10.5%
]
10.11%
2,38350.1%
[
10.5%
-
11.0%
]
10.69%
2,46965.2%
[
11.0%
-
11.5%
]
11.11%
22541.3%
[
11.5%
-
12.0%
]
11.87%
5,27541.9%
[
12.0%
-
12.5%
]
12.20%
3,15639.0%
[
12.5%
-
13.0%
]
12.93%
82055.0%
[
13.0%
-
13.5%
]
13.39%
12796.1%
[
14.0%
-
14.5%
]
14.34%
1,29063.1%
[
14.5%
-
15.0%
]
14.74%
1,32381.3%
[
15.5%
-
16.0%
]
15.79%
24757.5%
[
16.5%
-
17.0%
]
16.59%
4,29761.3%
[
17.0%
-
17.5%
]
17.29%
13322.4%
[
17.5%
-
18.0%
]
17.74%
3,90763.2%
[
20.5%
-
21.0%
]
20.70%
40168.8%
[
24.0%
-
24.5%
]
24.26%
2,49858.4%
[
26.0%
-
26.5%
]
26.09%
2387.5%
[
28.5%
-
29.0%
]
28.57%
5625.0%
[
32.0%
-
32.5%
]
32.05%
156100.0%
[
33.0%
-
33.5%
]
33.00%
20078.8%
[
33.5%
-
34.0%
]
33.93%
5636.1%
[
40.0%
-
40.5%
]
40.00%
5045.2%
[
41.5%
-
42.0%
]
41.67%
2457.1%
[
47.0%
-
47.5%
]
47.06%
17100.0%
[
50.0%
-
50.5%
]
50.00%
4100.0%
[
99.5%
-
100.0%
]
100.00%
3100.0%