Mexican American Indian Disability Age Under 5
COMPARE
Mexican American Indian
Select to Compare
Disability Age Under 5
Mexican American Indian Disability Age Under 5
1.3%
DISABILITY | AGE UNDER 5
36.6/ 100
METRIC RATING
191st/ 347
METRIC RANK
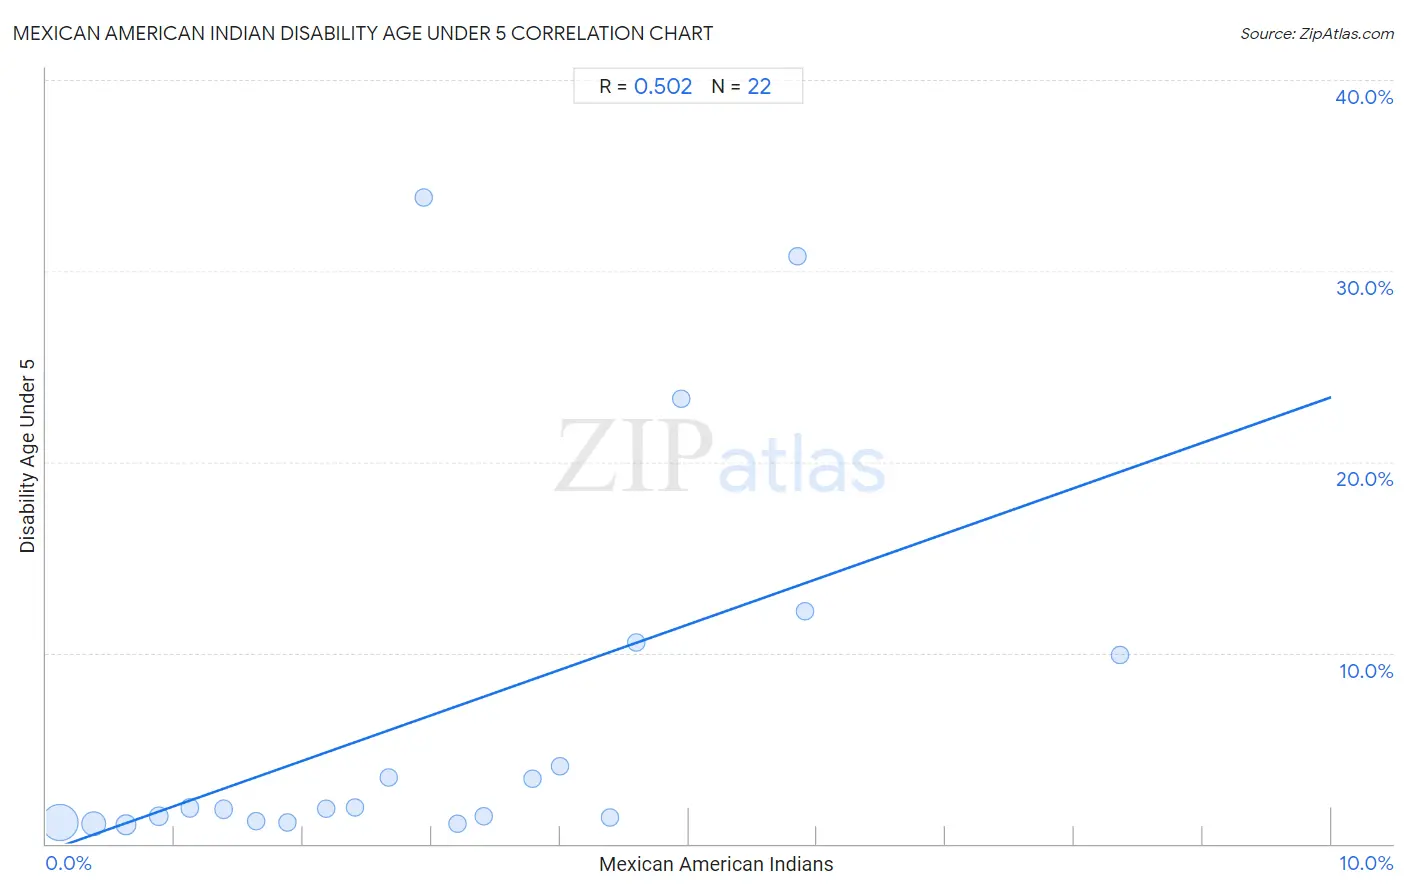
Mexican American Indian Disability Age Under 5 Correlation Chart
The statistical analysis conducted on geographies consisting of 193,676,549 people shows a substantial positive correlation between the proportion of Mexican American Indians and percentage of population with a disability under the age of 5 in the United States with a correlation coefficient (R) of 0.502 and weighted average of 1.3%. On average, for every 1% (one percent) increase in Mexican American Indians within a typical geography, there is an increase of 2.4% in percentage of population with a disability under the age of 5.
It is essential to understand that the correlation between the percentage of Mexican American Indians and percentage of population with a disability under the age of 5 does not imply a direct cause-and-effect relationship. It remains uncertain whether the presence of Mexican American Indians influences an upward or downward trend in the level of percentage of population with a disability under the age of 5 within an area, or if Mexican American Indians simply ended up residing in those areas with higher or lower levels of percentage of population with a disability under the age of 5 due to other factors.
Demographics Similar to Mexican American Indians by Disability Age Under 5
In terms of disability age under 5, the demographic groups most similar to Mexican American Indians are Immigrants from Bosnia and Herzegovina (1.3%, a difference of 0.0%), Immigrants from Sierra Leone (1.3%, a difference of 0.0%), Immigrants from Laos (1.3%, a difference of 0.010%), Peruvian (1.3%, a difference of 0.10%), and Immigrants from North Macedonia (1.3%, a difference of 0.18%).
| Demographics | Rating | Rank | Disability Age Under 5 |
| Palestinians | 43.0 /100 | #184 | Average 1.2% |
| Immigrants from Western Africa | 42.5 /100 | #185 | Average 1.2% |
| Cubans | 42.5 /100 | #186 | Average 1.2% |
| Immigrants from Haiti | 40.2 /100 | #187 | Average 1.3% |
| Haitians | 39.9 /100 | #188 | Fair 1.3% |
| Peruvians | 37.6 /100 | #189 | Fair 1.3% |
| Immigrants from Laos | 36.6 /100 | #190 | Fair 1.3% |
| Mexican American Indians | 36.6 /100 | #191 | Fair 1.3% |
| Immigrants from Bosnia and Herzegovina | 36.5 /100 | #192 | Fair 1.3% |
| Immigrants from Sierra Leone | 36.5 /100 | #193 | Fair 1.3% |
| Immigrants from North Macedonia | 34.7 /100 | #194 | Fair 1.3% |
| U.S. Virgin Islanders | 34.4 /100 | #195 | Fair 1.3% |
| Immigrants from Belgium | 31.4 /100 | #196 | Fair 1.3% |
| Immigrants from Somalia | 31.3 /100 | #197 | Fair 1.3% |
| Immigrants from Norway | 31.1 /100 | #198 | Fair 1.3% |
Mexican American Indian Disability Age Under 5 Correlation Summary
| Measurement | Mexican American Indian Data | Disability Age Under 5 Data |
| Minimum | 0.11% | 1.0% |
| Maximum | 8.4% | 33.9% |
| Range | 8.2% | 32.9% |
| Mean | 3.0% | 6.8% |
| Median | 2.8% | 1.9% |
| Interquartile 25% (IQ1) | 1.4% | 1.2% |
| Interquartile 75% (IQ3) | 4.4% | 9.9% |
| Interquartile Range (IQR) | 3.0% | 8.7% |
| Standard Deviation (Sample) | 2.1% | 9.9% |
| Standard Deviation (Population) | 2.0% | 9.6% |
Correlation Details
| Mexican American Indian Percentile | Sample Size | Disability Age Under 5 |
[ 0.0% - 0.5% ] 0.11% | 119,061,308 | 1.1% |
[ 0.0% - 0.5% ] 0.37% | 40,377,577 | 1.1% |
[ 0.5% - 1.0% ] 0.62% | 18,877,808 | 1.0% |
[ 0.5% - 1.0% ] 0.87% | 7,732,468 | 1.4% |
[ 1.0% - 1.5% ] 1.12% | 2,709,945 | 1.9% |
[ 1.0% - 1.5% ] 1.38% | 1,595,633 | 1.8% |
[ 1.5% - 2.0% ] 1.63% | 1,332,214 | 1.2% |
[ 1.5% - 2.0% ] 1.88% | 691,618 | 1.1% |
[ 2.0% - 2.5% ] 2.17% | 608,332 | 1.9% |
[ 2.0% - 2.5% ] 2.40% | 263,365 | 1.9% |
[ 2.5% - 3.0% ] 2.67% | 110,320 | 3.5% |
[ 2.5% - 3.0% ] 2.94% | 1,463 | 33.9% |
[ 3.0% - 3.5% ] 3.20% | 140,768 | 1.0% |
[ 3.0% - 3.5% ] 3.40% | 84,713 | 1.4% |
[ 3.5% - 4.0% ] 3.78% | 9,645 | 3.4% |
[ 3.5% - 4.0% ] 4.00% | 51,870 | 4.0% |
[ 4.0% - 4.5% ] 4.39% | 7,015 | 1.4% |
[ 4.5% - 5.0% ] 4.59% | 2,201 | 10.5% |
[ 4.5% - 5.0% ] 4.94% | 506 | 23.3% |
[ 5.5% - 6.0% ] 5.85% | 171 | 30.8% |
[ 5.5% - 6.0% ] 5.91% | 16,687 | 12.2% |
[ 8.0% - 8.5% ] 8.35% | 922 | 9.9% |