Macedonian 3 or more Vehicles in Household
COMPARE
Macedonian
Select to Compare
3 or more Vehicles in Household
Macedonian 3 or more Vehicles in Household
17.7%
3+ VEHICLES AVAILABLE
0.8/ 100
METRIC RATING
266th/ 347
METRIC RANK
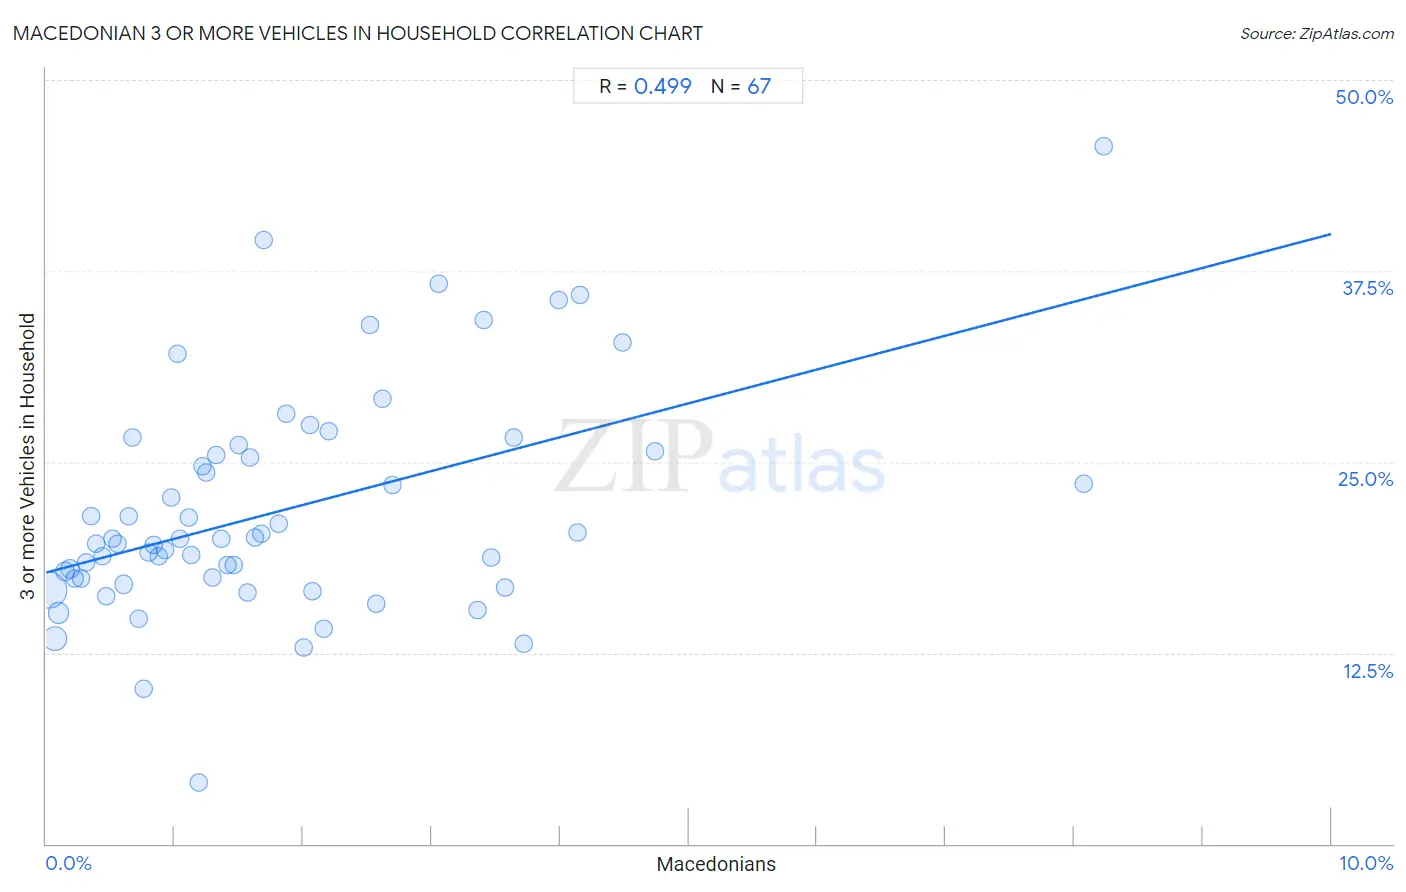
Macedonian 3 or more Vehicles in Household Correlation Chart
The statistical analysis conducted on geographies consisting of 132,563,114 people shows a moderate positive correlation between the proportion of Macedonians and percentage of households with 3 or more vehicles available in the United States with a correlation coefficient (R) of 0.499 and weighted average of 17.7%. On average, for every 1% (one percent) increase in Macedonians within a typical geography, there is an increase of 2.2% in percentage of households with 3 or more vehicles available.
It is essential to understand that the correlation between the percentage of Macedonians and percentage of households with 3 or more vehicles available does not imply a direct cause-and-effect relationship. It remains uncertain whether the presence of Macedonians influences an upward or downward trend in the level of percentage of households with 3 or more vehicles available within an area, or if Macedonians simply ended up residing in those areas with higher or lower levels of percentage of households with 3 or more vehicles available due to other factors.
Demographics Similar to Macedonians by 3 or more Vehicles in Household
In terms of 3 or more vehicles in household, the demographic groups most similar to Macedonians are Immigrants from Panama (17.7%, a difference of 0.020%), Immigrants from Venezuela (17.7%, a difference of 0.050%), Immigrants from Bulgaria (17.7%, a difference of 0.070%), Cambodian (17.8%, a difference of 0.16%), and Bermudan (17.8%, a difference of 0.19%).
| Demographics | Rating | Rank | 3 or more Vehicles in Household |
| Uruguayans | 1.0 /100 | #259 | Tragic 17.8% |
| Ugandans | 0.9 /100 | #260 | Tragic 17.8% |
| Immigrants from Northern Africa | 0.9 /100 | #261 | Tragic 17.8% |
| Colombians | 0.9 /100 | #262 | Tragic 17.8% |
| Bermudans | 0.9 /100 | #263 | Tragic 17.8% |
| Cambodians | 0.9 /100 | #264 | Tragic 17.8% |
| Immigrants from Panama | 0.8 /100 | #265 | Tragic 17.7% |
| Macedonians | 0.8 /100 | #266 | Tragic 17.7% |
| Immigrants from Venezuela | 0.8 /100 | #267 | Tragic 17.7% |
| Immigrants from Bulgaria | 0.8 /100 | #268 | Tragic 17.7% |
| Immigrants from France | 0.6 /100 | #269 | Tragic 17.6% |
| Immigrants from Nepal | 0.6 /100 | #270 | Tragic 17.6% |
| South Americans | 0.6 /100 | #271 | Tragic 17.6% |
| Immigrants from Africa | 0.5 /100 | #272 | Tragic 17.6% |
| Immigrants from Sudan | 0.5 /100 | #273 | Tragic 17.6% |
Macedonian 3 or more Vehicles in Household Correlation Summary
| Measurement | Macedonian Data | 3 or more Vehicles in Household Data |
| Minimum | 0.016% | 4.0% |
| Maximum | 8.2% | 45.7% |
| Range | 8.2% | 41.6% |
| Mean | 1.8% | 21.8% |
| Median | 1.4% | 19.9% |
| Interquartile 25% (IQ1) | 0.67% | 17.3% |
| Interquartile 75% (IQ3) | 2.6% | 25.7% |
| Interquartile Range (IQR) | 1.9% | 8.4% |
| Standard Deviation (Sample) | 1.7% | 7.4% |
| Standard Deviation (Population) | 1.6% | 7.3% |
Correlation Details
| Macedonian Percentile | Sample Size | 3 or more Vehicles in Household |
[ 0.0% - 0.5% ] 0.016% | 75,267,436 | 16.6% |
[ 0.0% - 0.5% ] 0.065% | 26,215,094 | 13.4% |
[ 0.0% - 0.5% ] 0.098% | 11,876,509 | 15.1% |
[ 0.0% - 0.5% ] 0.14% | 4,487,638 | 17.8% |
[ 0.0% - 0.5% ] 0.18% | 4,063,121 | 18.0% |
[ 0.0% - 0.5% ] 0.22% | 2,078,163 | 17.4% |
[ 0.0% - 0.5% ] 0.27% | 1,372,668 | 17.3% |
[ 0.0% - 0.5% ] 0.31% | 723,232 | 18.4% |
[ 0.0% - 0.5% ] 0.35% | 988,232 | 21.4% |
[ 0.0% - 0.5% ] 0.39% | 960,676 | 19.6% |
[ 0.0% - 0.5% ] 0.43% | 347,978 | 18.8% |
[ 0.0% - 0.5% ] 0.47% | 389,295 | 16.2% |
[ 0.5% - 1.0% ] 0.51% | 438,912 | 20.0% |
[ 0.5% - 1.0% ] 0.56% | 315,771 | 19.6% |
[ 0.5% - 1.0% ] 0.60% | 324,671 | 17.0% |
[ 0.5% - 1.0% ] 0.64% | 181,308 | 21.4% |
[ 0.5% - 1.0% ] 0.67% | 224,835 | 26.6% |
[ 0.5% - 1.0% ] 0.72% | 235,931 | 14.7% |
[ 0.5% - 1.0% ] 0.76% | 255,661 | 10.2% |
[ 0.5% - 1.0% ] 0.79% | 168,940 | 19.1% |
[ 0.5% - 1.0% ] 0.84% | 255,629 | 19.6% |
[ 0.5% - 1.0% ] 0.88% | 107,275 | 18.8% |
[ 0.5% - 1.0% ] 0.93% | 60,671 | 19.3% |
[ 0.5% - 1.0% ] 0.97% | 42,014 | 22.6% |
[ 1.0% - 1.5% ] 1.02% | 28,606 | 32.1% |
[ 1.0% - 1.5% ] 1.04% | 143,414 | 20.0% |
[ 1.0% - 1.5% ] 1.11% | 34,403 | 21.4% |
[ 1.0% - 1.5% ] 1.12% | 47,066 | 18.9% |
[ 1.0% - 1.5% ] 1.19% | 72,719 | 4.0% |
[ 1.0% - 1.5% ] 1.22% | 124,005 | 24.7% |
[ 1.0% - 1.5% ] 1.24% | 81,951 | 24.3% |
[ 1.0% - 1.5% ] 1.29% | 41,610 | 17.4% |
[ 1.0% - 1.5% ] 1.32% | 4,151 | 25.4% |
[ 1.0% - 1.5% ] 1.37% | 62,047 | 19.9% |
[ 1.0% - 1.5% ] 1.42% | 13,778 | 18.3% |
[ 1.0% - 1.5% ] 1.46% | 54,704 | 18.3% |
[ 1.0% - 1.5% ] 1.50% | 14,072 | 26.1% |
[ 1.5% - 2.0% ] 1.56% | 11,197 | 16.4% |
[ 1.5% - 2.0% ] 1.59% | 119,716 | 25.3% |
[ 1.5% - 2.0% ] 1.63% | 24,333 | 20.1% |
[ 1.5% - 2.0% ] 1.67% | 1,017 | 20.3% |
[ 1.5% - 2.0% ] 1.69% | 7,219 | 39.5% |
[ 1.5% - 2.0% ] 1.81% | 39,823 | 21.0% |
[ 1.5% - 2.0% ] 1.87% | 7,763 | 28.1% |
[ 2.0% - 2.5% ] 2.00% | 950 | 12.8% |
[ 2.0% - 2.5% ] 2.05% | 536 | 27.4% |
[ 2.0% - 2.5% ] 2.07% | 19,956 | 16.6% |
[ 2.0% - 2.5% ] 2.16% | 3,282 | 14.1% |
[ 2.0% - 2.5% ] 2.20% | 4,137 | 27.0% |
[ 2.5% - 3.0% ] 2.52% | 32,193 | 34.0% |
[ 2.5% - 3.0% ] 2.57% | 5,185 | 15.7% |
[ 2.5% - 3.0% ] 2.62% | 458 | 29.1% |
[ 2.5% - 3.0% ] 2.69% | 42,522 | 23.5% |
[ 3.0% - 3.5% ] 3.06% | 7,329 | 36.7% |
[ 3.0% - 3.5% ] 3.36% | 5,118 | 15.3% |
[ 3.0% - 3.5% ] 3.41% | 323 | 34.3% |
[ 3.0% - 3.5% ] 3.47% | 2,999 | 18.7% |
[ 3.5% - 4.0% ] 3.57% | 64,944 | 16.8% |
[ 3.5% - 4.0% ] 3.64% | 21,806 | 26.6% |
[ 3.5% - 4.0% ] 3.72% | 6,322 | 13.1% |
[ 3.5% - 4.0% ] 3.99% | 4,993 | 35.6% |
[ 4.0% - 4.5% ] 4.14% | 266 | 20.4% |
[ 4.0% - 4.5% ] 4.16% | 409 | 36.0% |
[ 4.0% - 4.5% ] 4.49% | 2,363 | 32.8% |
[ 4.5% - 5.0% ] 4.74% | 20,310 | 25.7% |
[ 8.0% - 8.5% ] 8.07% | 1,301 | 23.6% |
[ 8.0% - 8.5% ] 8.23% | 158 | 45.7% |