Immigrants from Sierra Leone In Labor Force | Age 25-29
COMPARE
Immigrants from Sierra Leone
Select to Compare
In Labor Force | Age 25-29
Immigrants from Sierra Leone In Labor Force | Age 25-29
85.7%
IN LABOR FORCE | AGE 25-29
99.9/ 100
METRIC RATING
45th/ 347
METRIC RANK
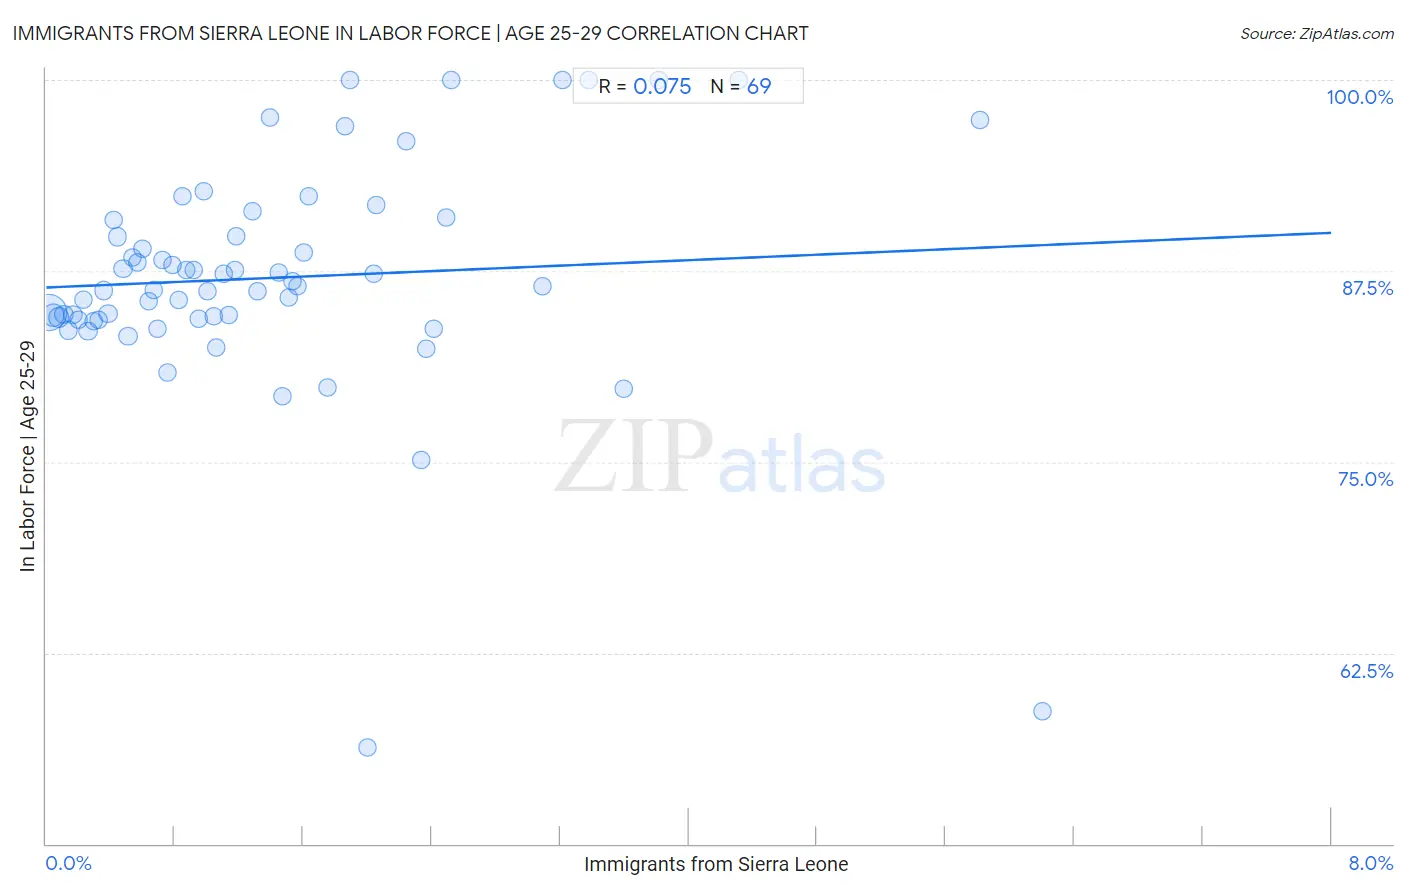
Immigrants from Sierra Leone In Labor Force | Age 25-29 Correlation Chart
The statistical analysis conducted on geographies consisting of 101,649,226 people shows a slight positive correlation between the proportion of Immigrants from Sierra Leone and labor force participation rate among population between the ages 25 and 29 in the United States with a correlation coefficient (R) of 0.075 and weighted average of 85.7%. On average, for every 1% (one percent) increase in Immigrants from Sierra Leone within a typical geography, there is an increase of 0.45% in labor force participation rate among population between the ages 25 and 29.
It is essential to understand that the correlation between the percentage of Immigrants from Sierra Leone and labor force participation rate among population between the ages 25 and 29 does not imply a direct cause-and-effect relationship. It remains uncertain whether the presence of Immigrants from Sierra Leone influences an upward or downward trend in the level of labor force participation rate among population between the ages 25 and 29 within an area, or if Immigrants from Sierra Leone simply ended up residing in those areas with higher or lower levels of labor force participation rate among population between the ages 25 and 29 due to other factors.
Demographics Similar to Immigrants from Sierra Leone by In Labor Force | Age 25-29
In terms of in labor force | age 25-29, the demographic groups most similar to Immigrants from Sierra Leone are Macedonian (85.7%, a difference of 0.0%), Immigrants from India (85.7%, a difference of 0.010%), Immigrants from Eritrea (85.7%, a difference of 0.020%), Czech (85.6%, a difference of 0.030%), and Immigrants from Greece (85.7%, a difference of 0.060%).
| Demographics | Rating | Rank | In Labor Force | Age 25-29 |
| Sierra Leoneans | 99.9 /100 | #38 | Exceptional 85.8% |
| Croatians | 99.9 /100 | #39 | Exceptional 85.8% |
| Immigrants from Albania | 99.9 /100 | #40 | Exceptional 85.7% |
| Immigrants from Greece | 99.9 /100 | #41 | Exceptional 85.7% |
| Immigrants from Eritrea | 99.9 /100 | #42 | Exceptional 85.7% |
| Immigrants from India | 99.9 /100 | #43 | Exceptional 85.7% |
| Macedonians | 99.9 /100 | #44 | Exceptional 85.7% |
| Immigrants from Sierra Leone | 99.9 /100 | #45 | Exceptional 85.7% |
| Czechs | 99.8 /100 | #46 | Exceptional 85.6% |
| Turks | 99.8 /100 | #47 | Exceptional 85.6% |
| Italians | 99.8 /100 | #48 | Exceptional 85.6% |
| Swedes | 99.8 /100 | #49 | Exceptional 85.6% |
| Yugoslavians | 99.8 /100 | #50 | Exceptional 85.6% |
| Immigrants from Latvia | 99.8 /100 | #51 | Exceptional 85.6% |
| Immigrants from Poland | 99.7 /100 | #52 | Exceptional 85.6% |
Immigrants from Sierra Leone In Labor Force | Age 25-29 Correlation Summary
| Measurement | Immigrants from Sierra Leone Data | In Labor Force | Age 25-29 Data |
| Minimum | 0.014% | 56.3% |
| Maximum | 6.2% | 100.0% |
| Range | 6.2% | 43.7% |
| Mean | 1.4% | 87.1% |
| Median | 1.1% | 86.5% |
| Interquartile 25% (IQ1) | 0.52% | 84.4% |
| Interquartile 75% (IQ3) | 1.9% | 90.3% |
| Interquartile Range (IQR) | 1.4% | 6.0% |
| Standard Deviation (Sample) | 1.3% | 7.6% |
| Standard Deviation (Population) | 1.3% | 7.5% |
Correlation Details
| Immigrants from Sierra Leone Percentile | Sample Size | In Labor Force | Age 25-29 |
[ 0.0% - 0.5% ] 0.014% | 59,331,558 | 84.8% |
[ 0.0% - 0.5% ] 0.044% | 14,637,289 | 84.6% |
[ 0.0% - 0.5% ] 0.077% | 7,927,916 | 84.4% |
[ 0.0% - 0.5% ] 0.11% | 3,818,673 | 84.7% |
[ 0.0% - 0.5% ] 0.14% | 2,452,856 | 83.6% |
[ 0.0% - 0.5% ] 0.17% | 1,937,557 | 84.6% |
[ 0.0% - 0.5% ] 0.20% | 1,614,728 | 84.3% |
[ 0.0% - 0.5% ] 0.23% | 2,108,030 | 85.6% |
[ 0.0% - 0.5% ] 0.26% | 518,009 | 83.6% |
[ 0.0% - 0.5% ] 0.29% | 596,988 | 84.2% |
[ 0.0% - 0.5% ] 0.32% | 1,001,569 | 84.3% |
[ 0.0% - 0.5% ] 0.36% | 417,881 | 86.2% |
[ 0.0% - 0.5% ] 0.38% | 453,562 | 84.7% |
[ 0.0% - 0.5% ] 0.42% | 330,557 | 90.8% |
[ 0.0% - 0.5% ] 0.45% | 425,192 | 89.7% |
[ 0.0% - 0.5% ] 0.48% | 500,099 | 87.6% |
[ 0.5% - 1.0% ] 0.51% | 316,254 | 83.2% |
[ 0.5% - 1.0% ] 0.54% | 355,837 | 88.4% |
[ 0.5% - 1.0% ] 0.57% | 309,343 | 88.1% |
[ 0.5% - 1.0% ] 0.60% | 55,303 | 89.0% |
[ 0.5% - 1.0% ] 0.64% | 206,121 | 85.6% |
[ 0.5% - 1.0% ] 0.67% | 97,497 | 86.3% |
[ 0.5% - 1.0% ] 0.70% | 116,177 | 83.7% |
[ 0.5% - 1.0% ] 0.72% | 167,473 | 88.2% |
[ 0.5% - 1.0% ] 0.76% | 123,699 | 80.8% |
[ 0.5% - 1.0% ] 0.79% | 110,125 | 87.9% |
[ 0.5% - 1.0% ] 0.82% | 312,285 | 85.6% |
[ 0.5% - 1.0% ] 0.85% | 120,186 | 92.4% |
[ 0.5% - 1.0% ] 0.87% | 117,687 | 87.6% |
[ 0.5% - 1.0% ] 0.92% | 58,787 | 87.5% |
[ 0.5% - 1.0% ] 0.95% | 130,738 | 84.4% |
[ 0.5% - 1.0% ] 0.98% | 7,129 | 92.7% |
[ 1.0% - 1.5% ] 1.00% | 85,494 | 86.2% |
[ 1.0% - 1.5% ] 1.05% | 35,552 | 84.5% |
[ 1.0% - 1.5% ] 1.06% | 11,455 | 82.5% |
[ 1.0% - 1.5% ] 1.11% | 137,976 | 87.4% |
[ 1.0% - 1.5% ] 1.14% | 27,761 | 84.6% |
[ 1.0% - 1.5% ] 1.17% | 39,527 | 87.6% |
[ 1.0% - 1.5% ] 1.18% | 98,008 | 89.8% |
[ 1.0% - 1.5% ] 1.28% | 24,430 | 91.4% |
[ 1.0% - 1.5% ] 1.31% | 32,842 | 86.2% |
[ 1.0% - 1.5% ] 1.39% | 20,794 | 97.5% |
[ 1.0% - 1.5% ] 1.45% | 26,573 | 87.4% |
[ 1.0% - 1.5% ] 1.47% | 3,052 | 79.3% |
[ 1.5% - 2.0% ] 1.51% | 20,031 | 85.8% |
[ 1.5% - 2.0% ] 1.53% | 33,855 | 86.9% |
[ 1.5% - 2.0% ] 1.56% | 44,149 | 86.5% |
[ 1.5% - 2.0% ] 1.60% | 45,799 | 88.7% |
[ 1.5% - 2.0% ] 1.63% | 4,226 | 92.4% |
[ 1.5% - 2.0% ] 1.75% | 4,683 | 79.9% |
[ 1.5% - 2.0% ] 1.86% | 6,335 | 97.0% |
[ 1.5% - 2.0% ] 1.89% | 2,376 | 100.0% |
[ 2.0% - 2.5% ] 2.00% | 1,049 | 56.3% |
[ 2.0% - 2.5% ] 2.04% | 12,017 | 87.3% |
[ 2.0% - 2.5% ] 2.06% | 37,275 | 91.8% |
[ 2.0% - 2.5% ] 2.24% | 14,901 | 96.0% |
[ 2.0% - 2.5% ] 2.33% | 19,465 | 75.1% |
[ 2.0% - 2.5% ] 2.36% | 71,682 | 82.4% |
[ 2.0% - 2.5% ] 2.41% | 9,574 | 83.7% |
[ 2.0% - 2.5% ] 2.49% | 40,201 | 91.0% |
[ 2.5% - 3.0% ] 2.52% | 2,219 | 100.0% |
[ 3.0% - 3.5% ] 3.09% | 19,531 | 86.5% |
[ 3.0% - 3.5% ] 3.21% | 1,277 | 100.0% |
[ 3.0% - 3.5% ] 3.37% | 2,460 | 100.0% |
[ 3.5% - 4.0% ] 3.59% | 19,369 | 79.8% |
[ 3.5% - 4.0% ] 3.82% | 5,976 | 100.0% |
[ 4.0% - 4.5% ] 4.31% | 1,924 | 100.0% |
[ 5.5% - 6.0% ] 5.81% | 3,287 | 97.4% |
[ 6.0% - 6.5% ] 6.20% | 4,996 | 58.7% |