Danish Disability
COMPARE
Danish
Select to Compare
Disability
Danish Disability
12.0%
DISABILITY
8.7/ 100
METRIC RATING
209th/ 347
METRIC RANK
Danish Disability Correlation Chart
The statistical analysis conducted on geographies consisting of 474,128,503 people shows a moderate positive correlation between the proportion of Danes and percentage of population with a disability in the United States with a correlation coefficient (R) of 0.410 and weighted average of 12.0%. On average, for every 1% (one percent) increase in Danes within a typical geography, there is an increase of 0.37% in percentage of population with a disability.
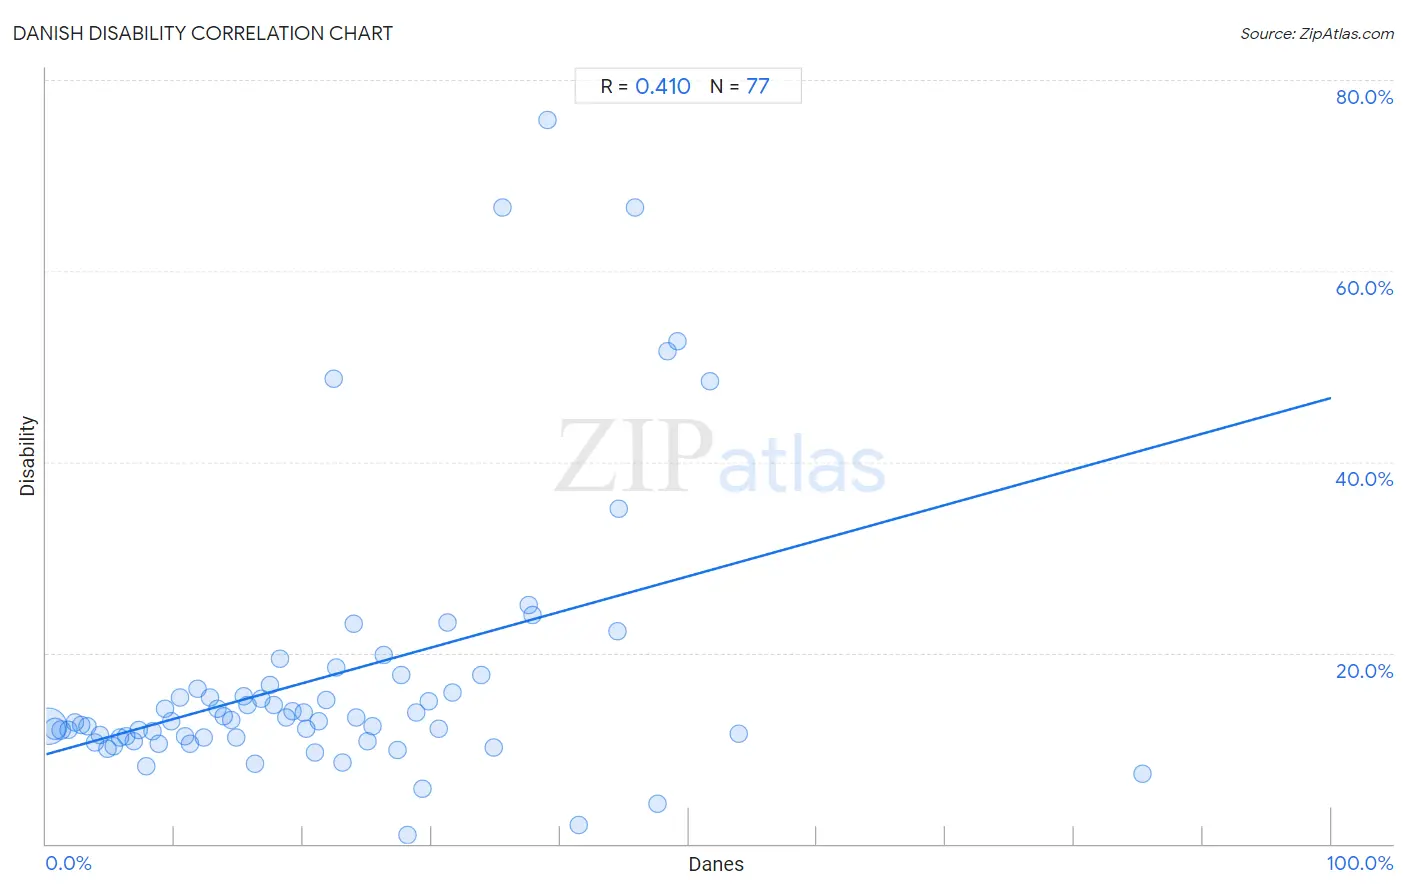
It is essential to understand that the correlation between the percentage of Danes and percentage of population with a disability does not imply a direct cause-and-effect relationship. It remains uncertain whether the presence of Danes influences an upward or downward trend in the level of percentage of population with a disability within an area, or if Danes simply ended up residing in those areas with higher or lower levels of percentage of population with a disability due to other factors.
Demographics Similar to Danes by Disability
In terms of disability, the demographic groups most similar to Danes are Immigrants from Caribbean (12.0%, a difference of 0.050%), Immigrants from Thailand (12.0%, a difference of 0.070%), Immigrants from Senegal (12.0%, a difference of 0.080%), Czech (12.0%, a difference of 0.13%), and Immigrants from Western Europe (12.0%, a difference of 0.17%).
| Demographics | Rating | Rank | Disability |
| Immigrants from England | 12.0 /100 | #202 | Poor 12.0% |
| British West Indians | 11.5 /100 | #203 | Poor 12.0% |
| Mexican American Indians | 11.4 /100 | #204 | Poor 12.0% |
| Immigrants from Western Europe | 10.1 /100 | #205 | Poor 12.0% |
| Immigrants from Senegal | 9.4 /100 | #206 | Tragic 12.0% |
| Immigrants from Thailand | 9.3 /100 | #207 | Tragic 12.0% |
| Immigrants from Caribbean | 9.1 /100 | #208 | Tragic 12.0% |
| Danes | 8.7 /100 | #209 | Tragic 12.0% |
| Czechs | 7.9 /100 | #210 | Tragic 12.0% |
| Immigrants from Cambodia | 7.3 /100 | #211 | Tragic 12.0% |
| Austrians | 7.2 /100 | #212 | Tragic 12.0% |
| Immigrants from Iraq | 7.1 /100 | #213 | Tragic 12.0% |
| Immigrants from Somalia | 6.8 /100 | #214 | Tragic 12.0% |
| Immigrants from Canada | 6.1 /100 | #215 | Tragic 12.1% |
| Panamanians | 5.4 /100 | #216 | Tragic 12.1% |
Danish Disability Correlation Summary
| Measurement | Danish Data | Disability Data |
| Minimum | 0.19% | 0.97% |
| Maximum | 85.3% | 75.8% |
| Range | 85.1% | 74.8% |
| Mean | 21.7% | 17.5% |
| Median | 19.2% | 12.9% |
| Interquartile 25% (IQ1) | 9.5% | 11.1% |
| Interquartile 75% (IQ3) | 30.1% | 16.5% |
| Interquartile Range (IQR) | 20.6% | 5.4% |
| Standard Deviation (Sample) | 15.8% | 14.3% |
| Standard Deviation (Population) | 15.6% | 14.2% |
Correlation Details
| Danish Percentile | Sample Size | Disability |
[ 0.0% - 0.5% ] 0.19% | 357,177,699 | 12.4% |
[ 0.5% - 1.0% ] 0.71% | 70,276,039 | 12.1% |
[ 1.0% - 1.5% ] 1.20% | 24,633,824 | 11.9% |
[ 1.5% - 2.0% ] 1.70% | 9,023,415 | 11.9% |
[ 2.0% - 2.5% ] 2.24% | 3,230,770 | 12.7% |
[ 2.5% - 3.0% ] 2.73% | 2,012,158 | 12.4% |
[ 3.0% - 3.5% ] 3.22% | 1,487,667 | 12.4% |
[ 3.5% - 4.0% ] 3.75% | 1,685,728 | 10.6% |
[ 4.0% - 4.5% ] 4.21% | 1,162,854 | 11.3% |
[ 4.5% - 5.0% ] 4.73% | 960,679 | 9.9% |
[ 5.0% - 5.5% ] 5.27% | 785,171 | 10.2% |
[ 5.5% - 6.0% ] 5.77% | 472,391 | 11.1% |
[ 6.0% - 6.5% ] 6.18% | 260,899 | 11.3% |
[ 6.5% - 7.0% ] 6.80% | 187,819 | 10.8% |
[ 7.0% - 7.5% ] 7.22% | 133,515 | 11.9% |
[ 7.5% - 8.0% ] 7.74% | 199,907 | 8.1% |
[ 8.0% - 8.5% ] 8.28% | 104,570 | 11.8% |
[ 8.5% - 9.0% ] 8.76% | 60,905 | 10.5% |
[ 9.0% - 9.5% ] 9.25% | 23,437 | 14.1% |
[ 9.5% - 10.0% ] 9.77% | 35,889 | 12.9% |
[ 10.0% - 10.5% ] 10.40% | 17,044 | 15.3% |
[ 10.5% - 11.0% ] 10.75% | 28,557 | 11.2% |
[ 11.0% - 11.5% ] 11.22% | 23,161 | 10.5% |
[ 11.5% - 12.0% ] 11.73% | 8,345 | 16.3% |
[ 12.0% - 12.5% ] 12.24% | 4,657 | 11.1% |
[ 12.5% - 13.0% ] 12.71% | 16,217 | 15.3% |
[ 13.0% - 13.5% ] 13.35% | 16,664 | 14.2% |
[ 13.5% - 14.0% ] 13.77% | 11,238 | 13.4% |
[ 14.0% - 14.5% ] 14.37% | 11,910 | 13.0% |
[ 14.5% - 15.0% ] 14.78% | 6,389 | 11.1% |
[ 15.0% - 15.5% ] 15.32% | 3,191 | 15.4% |
[ 15.5% - 16.0% ] 15.69% | 3,269 | 14.6% |
[ 16.0% - 16.5% ] 16.20% | 1,883 | 8.4% |
[ 16.5% - 17.0% ] 16.74% | 5,216 | 15.2% |
[ 17.0% - 17.5% ] 17.43% | 9,550 | 16.6% |
[ 17.5% - 18.0% ] 17.71% | 3,382 | 14.5% |
[ 18.0% - 18.5% ] 18.19% | 2,381 | 19.4% |
[ 18.5% - 19.0% ] 18.72% | 3,099 | 13.3% |
[ 19.0% - 19.5% ] 19.21% | 4,414 | 13.8% |
[ 20.0% - 20.5% ] 20.00% | 1,120 | 13.7% |
[ 20.0% - 20.5% ] 20.19% | 5,766 | 12.1% |
[ 20.5% - 21.0% ] 20.87% | 115 | 9.6% |
[ 21.0% - 21.5% ] 21.19% | 2,902 | 12.8% |
[ 21.5% - 22.0% ] 21.79% | 5,070 | 15.1% |
[ 22.0% - 22.5% ] 22.37% | 152 | 48.7% |
[ 22.5% - 23.0% ] 22.52% | 222 | 18.5% |
[ 23.0% - 23.5% ] 23.08% | 117 | 8.5% |
[ 23.5% - 24.0% ] 23.90% | 364 | 23.1% |
[ 24.0% - 24.5% ] 24.10% | 83 | 13.3% |
[ 25.0% - 25.5% ] 25.00% | 288 | 10.8% |
[ 25.0% - 25.5% ] 25.41% | 3,199 | 12.3% |
[ 26.0% - 26.5% ] 26.22% | 2,136 | 19.8% |
[ 27.0% - 27.5% ] 27.30% | 989 | 9.8% |
[ 27.5% - 28.0% ] 27.66% | 141 | 17.7% |
[ 28.0% - 28.5% ] 28.16% | 206 | 0.97% |
[ 28.5% - 29.0% ] 28.79% | 3,050 | 13.7% |
[ 29.0% - 29.5% ] 29.27% | 328 | 5.8% |
[ 29.5% - 30.0% ] 29.75% | 2,198 | 14.9% |
[ 30.5% - 31.0% ] 30.53% | 416 | 12.0% |
[ 31.0% - 31.5% ] 31.20% | 407 | 23.2% |
[ 31.5% - 32.0% ] 31.58% | 57 | 15.8% |
[ 33.5% - 34.0% ] 33.82% | 68 | 17.6% |
[ 34.5% - 35.0% ] 34.79% | 891 | 10.1% |
[ 35.0% - 35.5% ] 35.50% | 231 | 66.7% |
[ 37.0% - 37.5% ] 37.50% | 16 | 25.0% |
[ 37.5% - 38.0% ] 37.83% | 875 | 24.0% |
[ 38.5% - 39.0% ] 38.98% | 372 | 75.8% |
[ 41.0% - 41.5% ] 41.45% | 152 | 2.0% |
[ 44.0% - 44.5% ] 44.44% | 9 | 22.2% |
[ 44.5% - 45.0% ] 44.59% | 74 | 35.1% |
[ 45.5% - 46.0% ] 45.83% | 24 | 66.7% |
[ 47.5% - 48.0% ] 47.59% | 145 | 4.1% |
[ 48.0% - 48.5% ] 48.39% | 62 | 51.6% |
[ 49.0% - 49.5% ] 49.12% | 57 | 52.6% |
[ 51.5% - 52.0% ] 51.61% | 31 | 48.4% |
[ 53.5% - 54.0% ] 53.85% | 104 | 11.5% |
[ 85.0% - 85.5% ] 85.28% | 163 | 7.4% |