Albanian Married-couple Households
COMPARE
Albanian
Select to Compare
Married-couple Households
Albanian Married-couple Households
46.1%
MARRIED-COUPLE HOUSEHOLDS
31.1/ 100
METRIC RATING
186th/ 347
METRIC RANK
Albanian Married-couple Households Correlation Chart
The statistical analysis conducted on geographies consisting of 193,184,861 people shows a weak positive correlation between the proportion of Albanians and percentage of married-couple family households in the United States with a correlation coefficient (R) of 0.276 and weighted average of 46.1%. On average, for every 1% (one percent) increase in Albanians within a typical geography, there is an increase of 0.68% in percentage of married-couple family households.
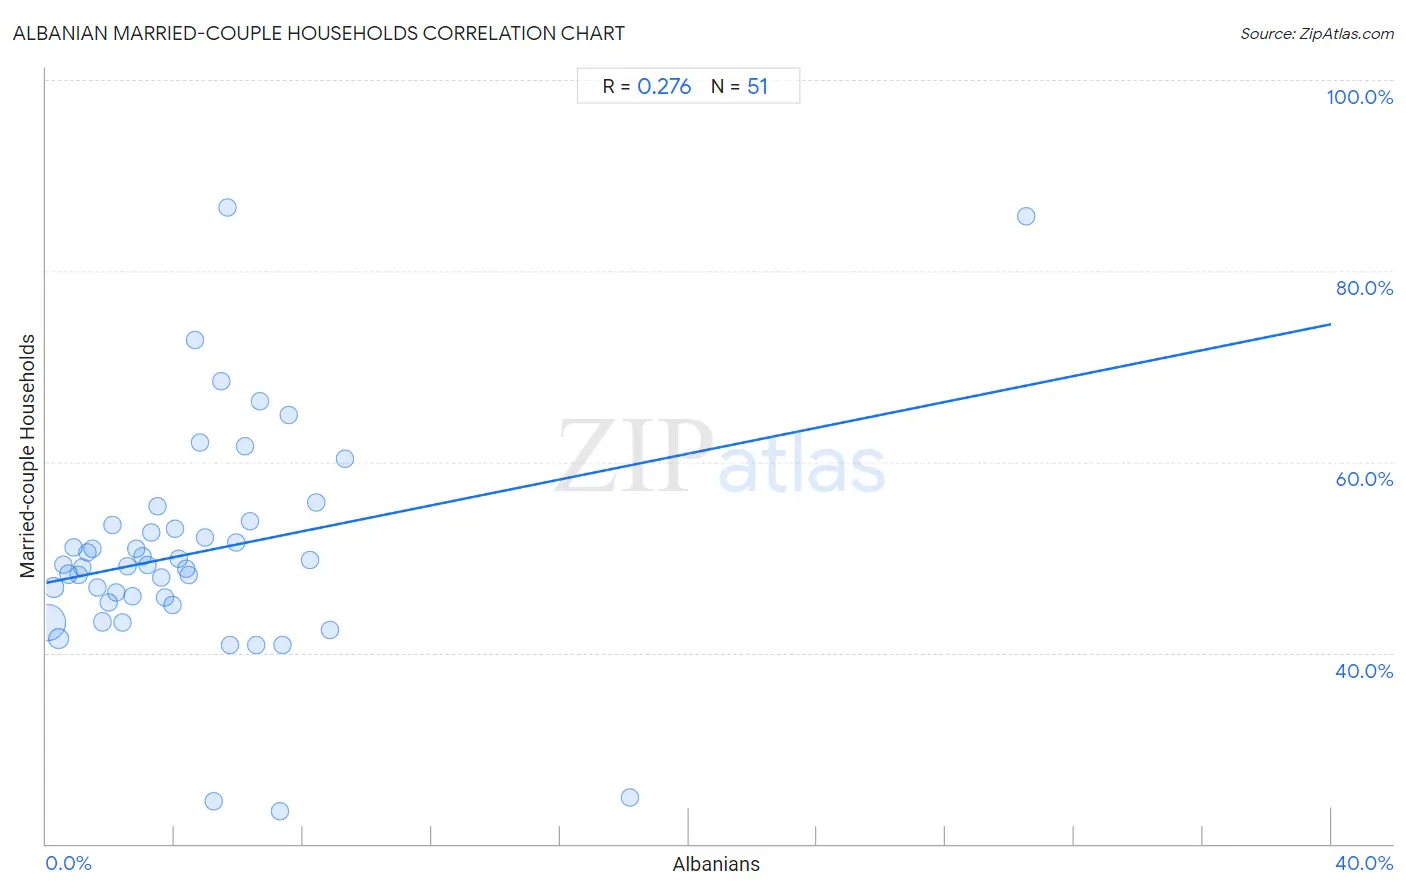
It is essential to understand that the correlation between the percentage of Albanians and percentage of married-couple family households does not imply a direct cause-and-effect relationship. It remains uncertain whether the presence of Albanians influences an upward or downward trend in the level of percentage of married-couple family households within an area, or if Albanians simply ended up residing in those areas with higher or lower levels of percentage of married-couple family households due to other factors.
Demographics Similar to Albanians by Married-couple Households
In terms of married-couple households, the demographic groups most similar to Albanians are Fijian (46.1%, a difference of 0.080%), South American Indian (46.0%, a difference of 0.13%), Brazilian (46.2%, a difference of 0.20%), Immigrants from Latvia (46.0%, a difference of 0.20%), and Immigrants from Switzerland (46.2%, a difference of 0.24%).
| Demographics | Rating | Rank | Married-couple Households |
| Immigrants from Zimbabwe | 43.0 /100 | #179 | Average 46.3% |
| Mongolians | 42.0 /100 | #180 | Average 46.3% |
| Malaysians | 41.8 /100 | #181 | Average 46.3% |
| Yugoslavians | 38.9 /100 | #182 | Fair 46.2% |
| Immigrants from Brazil | 38.3 /100 | #183 | Fair 46.2% |
| Immigrants from Switzerland | 36.9 /100 | #184 | Fair 46.2% |
| Brazilians | 35.9 /100 | #185 | Fair 46.2% |
| Albanians | 31.1 /100 | #186 | Fair 46.1% |
| Fijians | 29.2 /100 | #187 | Fair 46.1% |
| South American Indians | 28.4 /100 | #188 | Fair 46.0% |
| Immigrants from Latvia | 26.9 /100 | #189 | Fair 46.0% |
| Immigrants from Kuwait | 25.6 /100 | #190 | Fair 46.0% |
| Choctaw | 24.9 /100 | #191 | Fair 46.0% |
| Immigrants from Northern Africa | 24.6 /100 | #192 | Fair 46.0% |
| Taiwanese | 23.4 /100 | #193 | Fair 45.9% |
Albanian Married-couple Households Correlation Summary
| Measurement | Albanian Data | Married-couple Households Data |
| Minimum | 0.043% | 23.4% |
| Maximum | 30.5% | 86.6% |
| Range | 30.5% | 63.2% |
| Mean | 4.7% | 50.5% |
| Median | 3.9% | 49.1% |
| Interquartile 25% (IQ1) | 1.9% | 45.2% |
| Interquartile 75% (IQ3) | 6.2% | 53.3% |
| Interquartile Range (IQR) | 4.2% | 8.1% |
| Standard Deviation (Sample) | 4.8% | 11.9% |
| Standard Deviation (Population) | 4.8% | 11.8% |
Correlation Details
| Albanian Percentile | Sample Size | Married-couple Households |
[ 0.0% - 0.5% ] 0.043% | 136,069,728 | 43.2% |
[ 0.0% - 0.5% ] 0.21% | 18,115,236 | 46.9% |
[ 0.0% - 0.5% ] 0.40% | 20,171,888 | 41.4% |
[ 0.5% - 1.0% ] 0.53% | 5,077,732 | 49.2% |
[ 0.5% - 1.0% ] 0.68% | 3,440,951 | 48.2% |
[ 0.5% - 1.0% ] 0.84% | 1,716,176 | 51.1% |
[ 0.5% - 1.0% ] 1.00% | 1,364,158 | 48.1% |
[ 1.0% - 1.5% ] 1.14% | 1,361,053 | 48.9% |
[ 1.0% - 1.5% ] 1.30% | 1,034,168 | 50.5% |
[ 1.0% - 1.5% ] 1.44% | 585,678 | 50.9% |
[ 1.5% - 2.0% ] 1.60% | 477,249 | 46.8% |
[ 1.5% - 2.0% ] 1.75% | 740,270 | 43.2% |
[ 1.5% - 2.0% ] 1.95% | 412,933 | 45.2% |
[ 2.0% - 2.5% ] 2.08% | 225,004 | 53.3% |
[ 2.0% - 2.5% ] 2.18% | 496,877 | 46.4% |
[ 2.0% - 2.5% ] 2.36% | 280,740 | 43.2% |
[ 2.5% - 3.0% ] 2.53% | 442,934 | 49.1% |
[ 2.5% - 3.0% ] 2.69% | 151,151 | 45.9% |
[ 2.5% - 3.0% ] 2.80% | 198,768 | 50.9% |
[ 3.0% - 3.5% ] 3.01% | 142,430 | 50.1% |
[ 3.0% - 3.5% ] 3.17% | 84,041 | 49.1% |
[ 3.0% - 3.5% ] 3.26% | 53,740 | 52.6% |
[ 3.0% - 3.5% ] 3.45% | 101,541 | 55.3% |
[ 3.5% - 4.0% ] 3.59% | 96,803 | 47.9% |
[ 3.5% - 4.0% ] 3.71% | 85,575 | 45.8% |
[ 3.5% - 4.0% ] 3.93% | 74,335 | 45.0% |
[ 4.0% - 4.5% ] 4.03% | 8,966 | 53.0% |
[ 4.0% - 4.5% ] 4.13% | 7,948 | 49.9% |
[ 4.0% - 4.5% ] 4.34% | 13,777 | 48.8% |
[ 4.0% - 4.5% ] 4.43% | 33,894 | 48.2% |
[ 4.5% - 5.0% ] 4.63% | 5,338 | 72.8% |
[ 4.5% - 5.0% ] 4.80% | 2,937 | 62.0% |
[ 4.5% - 5.0% ] 4.93% | 30,413 | 52.1% |
[ 5.0% - 5.5% ] 5.20% | 173 | 24.4% |
[ 5.0% - 5.5% ] 5.47% | 2,415 | 68.4% |
[ 5.5% - 6.0% ] 5.63% | 1,350 | 86.6% |
[ 5.5% - 6.0% ] 5.72% | 41,328 | 40.8% |
[ 5.5% - 6.0% ] 5.92% | 7,337 | 51.5% |
[ 6.0% - 6.5% ] 6.17% | 3,304 | 61.6% |
[ 6.0% - 6.5% ] 6.32% | 3,700 | 53.8% |
[ 6.5% - 7.0% ] 6.53% | 383 | 40.8% |
[ 6.5% - 7.0% ] 6.64% | 2,047 | 66.3% |
[ 7.0% - 7.5% ] 7.28% | 2,336 | 23.4% |
[ 7.0% - 7.5% ] 7.37% | 1,656 | 40.8% |
[ 7.5% - 8.0% ] 7.54% | 2,017 | 64.9% |
[ 8.0% - 8.5% ] 8.19% | 891 | 49.7% |
[ 8.0% - 8.5% ] 8.41% | 2,353 | 55.8% |
[ 8.5% - 9.0% ] 8.82% | 6,653 | 42.5% |
[ 9.0% - 9.5% ] 9.30% | 1,409 | 60.4% |
[ 18.0% - 18.5% ] 18.16% | 936 | 24.8% |
[ 30.0% - 30.5% ] 30.50% | 141 | 85.7% |