Immigrants from North Macedonia Married-couple Households

COMPARE

Immigrants from North Macedonia
Race
Ancestry
AfghanAfricanAlaska NativeAlaskan AthabascanAlbanianAleutAlsatianAmericanApacheArabArapahoArgentineanArmenianAssyrian/Chaldean/SyriacAustralianAustrianBahamianBangladeshiBarbadianBasqueBelgianBelizeanBermudanBhutaneseBlackfeetBolivianBrazilianBritishBritish West IndianBulgarianBurmeseCajunCambodianCanadianCape VerdeanCarpatho RusynCelticCentral AmericanCentral American IndianCherokeeCheyenneChickasawChileanChineseChippewaChoctawColombianColvilleComancheCosta RicanCreeCreekCroatianCrowCubanCypriotCzechCzechoslovakianDanishDelawareDominicanDutchDutch West IndianEastern EuropeanEcuadorianEgyptianEnglishEstonianEthiopianEuropeanFijianFilipinoFinnishFrenchFrench American IndianFrench CanadianGermanGerman RussianGhanaianGreekGuamanian/ChamorroGuatemalanGuyaneseHaitianHmongHonduranHopiHoumaHungarianIcelanderIndian (Asian)IndonesianInupiatIranianIraqiIrishIroquoisIsraeliItalianJamaicanJapaneseJordanianKenyanKiowaKoreanLaotianLatvianLebaneseLiberianLithuanianLumbeeLuxembourgerMacedonianMalaysianMalteseMarshalleseMenomineeMexicanMexican American IndianMongolianMoroccanNative HawaiianNavajoNepaleseNew ZealanderNicaraguanNigerianNorthern EuropeanNorwegianOkinawanOsageOttawaPaiutePakistaniPalestinianPanamanianParaguayanPennsylvania GermanPeruvianPimaPolishPortuguesePotawatomiPuebloPuerto RicanPuget Sound SalishRomanianRussianSalvadoranSamoanScandinavianScotch-IrishScottishSeminoleSenegaleseSerbianShoshoneSierra LeoneanSiouxSlavicSlovakSloveneSomaliSouth AfricanSouth AmericanSouth American IndianSoviet UnionSpaniardSpanishSpanish AmericanSpanish American IndianSri LankanSubsaharan AfricanSudaneseSwedishSwissSyrianTaiwaneseThaiTlingit-HaidaTohono O'OdhamTonganTrinidadian and TobagonianTsimshianTurkishU.S. Virgin IslanderUgandanUkrainianUruguayanUteVenezuelanVietnameseWelshWest IndianYakamaYaquiYugoslavianYumanYup'ikZimbabwean
Immigration
NonimmigrantsImmigrantsAfghanistanAfricaAlbaniaArgentinaArmeniaAsiaAustraliaAustriaBahamasBangladeshBarbadosBelarusBelgiumBelizeBoliviaBosnia and HerzegovinaBrazilBulgariaBurma/MyanmarCabo VerdeCambodiaCameroonCanadaCaribbeanCentral AmericaChileChinaColombiaCongoCosta RicaCroatiaCubaCzechoslovakiaDenmarkDominicaDominican RepublicEastern AfricaEastern AsiaEastern EuropeEcuadorEgyptEl SalvadorEnglandEritreaEthiopiaEuropeFijiFranceGermanyGhanaGreeceGrenadaGuatemalaGuyanaHaitiHondurasHong KongHungaryIndiaIndonesiaIranIraqIrelandIsraelItalyJamaicaJapanJordanKazakhstanKenyaKoreaKuwaitLaosLatin AmericaLatviaLebanonLiberiaLithuaniaMalaysiaMexicoMicronesiaMiddle AfricaMoldovaMoroccoNepalNetherlandsNicaraguaNigeriaNorth AmericaNorth MacedoniaNorthern AfricaNorthern EuropeNorwayOceaniaPakistanPanamaPeruPhilippinesPolandPortugalRomaniaRussiaSaudi ArabiaScotlandSenegalSerbiaSierra LeoneSingaporeSomaliaSouth AfricaSouth AmericaSouth Central AsiaSouth Eastern AsiaSouthern EuropeSpainSri LankaSt. Vincent and the GrenadinesSudanSwedenSwitzerlandSyriaTaiwanThailandTrinidad and TobagoTurkeyUgandaUkraineUruguayUzbekistanVenezuelaVietnamWest IndiesWestern AfricaWestern AsiaWestern EuropeYemenZaireZimbabweAzores
Select to Compare
Race
Ancestry
AfghanAfricanAlaska NativeAlaskan AthabascanAlbanianAleutAlsatianAmericanApacheArabArapahoArgentineanArmenianAssyrian/Chaldean/SyriacAustralianAustrianBahamianBangladeshiBarbadianBasqueBelgianBelizeanBermudanBhutaneseBlackfeetBolivianBrazilianBritishBritish West IndianBulgarianBurmeseCajunCambodianCanadianCape VerdeanCarpatho RusynCelticCentral AmericanCentral American IndianCherokeeCheyenneChickasawChileanChineseChippewaChoctawColombianColvilleComancheCosta RicanCreeCreekCroatianCrowCubanCypriotCzechCzechoslovakianDanishDelawareDominicanDutchDutch West IndianEastern EuropeanEcuadorianEgyptianEnglishEstonianEthiopianEuropeanFijianFilipinoFinnishFrenchFrench American IndianFrench CanadianGermanGerman RussianGhanaianGreekGuamanian/ChamorroGuatemalanGuyaneseHaitianHmongHonduranHopiHoumaHungarianIcelanderIndian (Asian)IndonesianInupiatIranianIraqiIrishIroquoisIsraeliItalianJamaicanJapaneseJordanianKenyanKiowaKoreanLaotianLatvianLebaneseLiberianLithuanianLumbeeLuxembourgerMacedonianMalaysianMalteseMarshalleseMenomineeMexicanMexican American IndianMongolianMoroccanNative HawaiianNavajoNepaleseNew ZealanderNicaraguanNigerianNorthern EuropeanNorwegianOkinawanOsageOttawaPaiutePakistaniPalestinianPanamanianParaguayanPennsylvania GermanPeruvianPimaPolishPortuguesePotawatomiPuebloPuerto RicanPuget Sound SalishRomanianRussianSalvadoranSamoanScandinavianScotch-IrishScottishSeminoleSenegaleseSerbianShoshoneSierra LeoneanSiouxSlavicSlovakSloveneSomaliSouth AfricanSouth AmericanSouth American IndianSoviet UnionSpaniardSpanishSpanish AmericanSpanish American IndianSri LankanSubsaharan AfricanSudaneseSwedishSwissSyrianTaiwaneseThaiTlingit-HaidaTohono O'OdhamTonganTrinidadian and TobagonianTsimshianTurkishU.S. Virgin IslanderUgandanUkrainianUruguayanUteVenezuelanVietnameseWelshWest IndianYakamaYaquiYugoslavianYumanYup'ikZimbabwean
Immigration
NonimmigrantsImmigrantsAfghanistanAfricaAlbaniaArgentinaArmeniaAsiaAustraliaAustriaBahamasBangladeshBarbadosBelarusBelgiumBelizeBoliviaBosnia and HerzegovinaBrazilBulgariaBurma/MyanmarCabo VerdeCambodiaCameroonCanadaCaribbeanCentral AmericaChileChinaColombiaCongoCosta RicaCroatiaCubaCzechoslovakiaDenmarkDominicaDominican RepublicEastern AfricaEastern AsiaEastern EuropeEcuadorEgyptEl SalvadorEnglandEritreaEthiopiaEuropeFijiFranceGermanyGhanaGreeceGrenadaGuatemalaGuyanaHaitiHondurasHong KongHungaryIndiaIndonesiaIranIraqIrelandIsraelItalyJamaicaJapanJordanKazakhstanKenyaKoreaKuwaitLaosLatin AmericaLatviaLebanonLiberiaLithuaniaMalaysiaMexicoMicronesiaMiddle AfricaMoldovaMoroccoNepalNetherlandsNicaraguaNigeriaNorth AmericaNorthern AfricaNorthern EuropeNorwayOceaniaPakistanPanamaPeruPhilippinesPolandPortugalRomaniaRussiaSaudi ArabiaScotlandSenegalSerbiaSierra LeoneSingaporeSomaliaSouth AfricaSouth AmericaSouth Central AsiaSouth Eastern AsiaSouthern EuropeSpainSri LankaSt. Vincent and the GrenadinesSudanSwedenSwitzerlandSyriaTaiwanThailandTrinidad and TobagoTurkeyUgandaUkraineUruguayUzbekistanVenezuelaVietnamWest IndiesWestern AfricaWestern AsiaWestern EuropeYemenZaireZimbabweAzores
Married-couple Households
Income
Poverty
Unemployment
Labor Participation
Family Structure
Vehicle Availability
Education Level
Disability

Immigrants from North Macedonia Married-couple Households
Exceptional

47.9%
MARRIED-COUPLE HOUSEHOLDS
96.4/ 100
METRIC RATING
98th/ 347
METRIC RANK

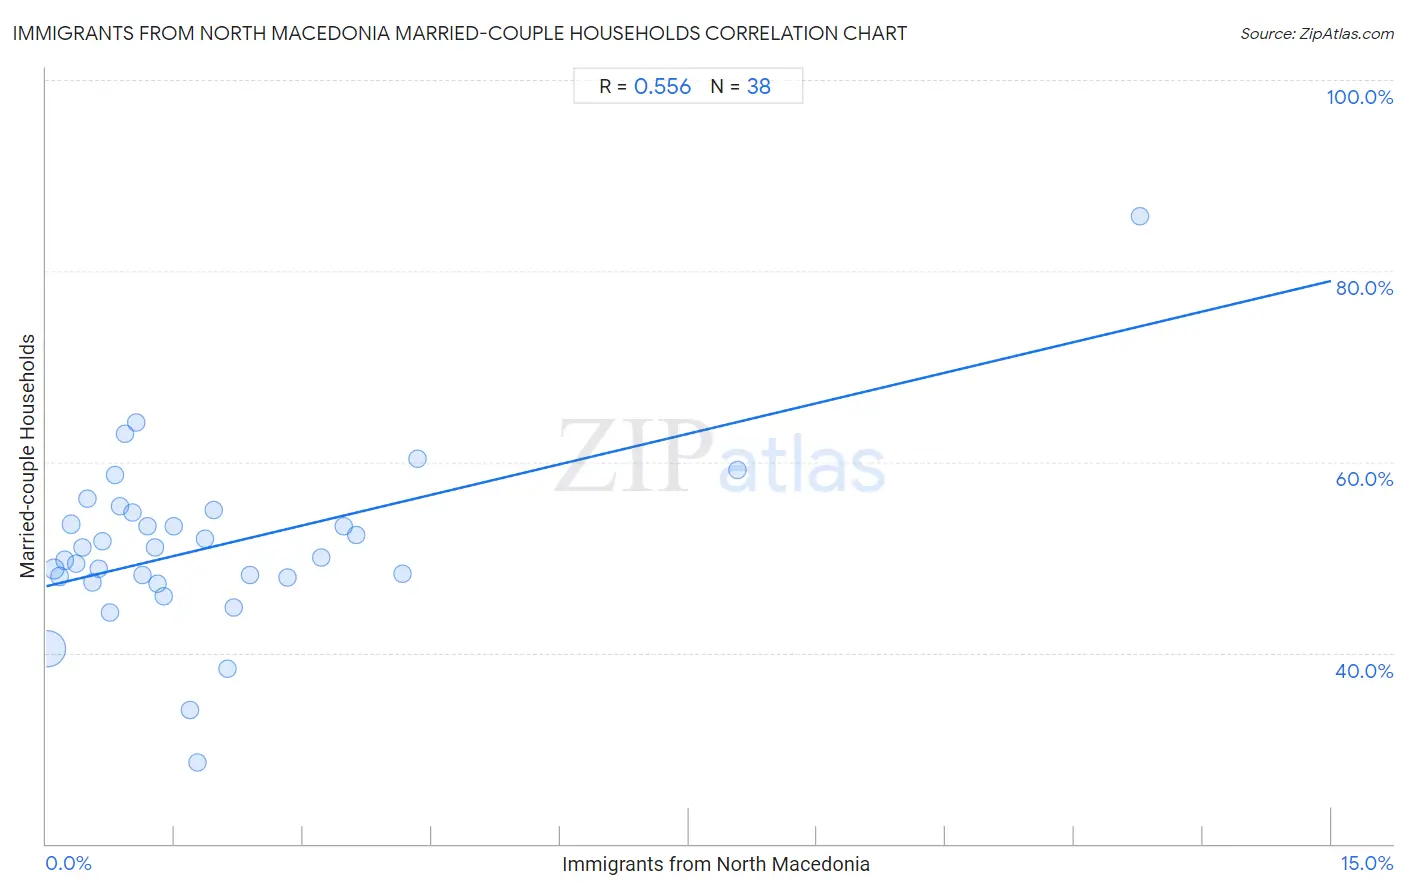
Immigrants from North Macedonia Married-couple Households Correlation Chart

The statistical analysis conducted on geographies consisting of 74,300,796 people shows a substantial positive correlation between the proportion of Immigrants from North Macedonia and percentage of married-couple family households in the United States with a correlation coefficient (R) of 0.556 and weighted average of 47.9%. On average, for every 1% (one percent) increase in Immigrants from North Macedonia within a typical geography, there is an increase of 2.1% in percentage of married-couple family households.
Immigrants from North Macedonia Married-couple Households
It is essential to understand that the correlation between the percentage of Immigrants from North Macedonia and percentage of married-couple family households does not imply a direct cause-and-effect relationship. It remains uncertain whether the presence of Immigrants from North Macedonia influences an upward or downward trend in the level of percentage of married-couple family households within an area, or if Immigrants from North Macedonia simply ended up residing in those areas with higher or lower levels of percentage of married-couple family households due to other factors.

Demographics Similar to Immigrants from North Macedonia by Married-couple Households

In terms of married-couple households, the demographic groups most similar to Immigrants from North Macedonia are Latvian (47.9%, a difference of 0.010%), Immigrants from Austria (47.9%, a difference of 0.010%), Immigrants from Italy (47.9%, a difference of 0.020%), Immigrants from Egypt (47.9%, a difference of 0.040%), and Turkish (47.8%, a difference of 0.080%).
DemographicsRating | RankMarried-couple Households
Immigrants from Moldova
97.0
/100
|
#91
Exceptional
48.0%
Palestinians
96.9
/100
|
#92
Exceptional
48.0%
Lebanese
96.9
/100
|
#93
Exceptional
47.9%
Americans
96.9
/100
|
#94
Exceptional
47.9%
Immigrants from Belgium
96.8
/100
|
#95
Exceptional
47.9%
Immigrants from Egypt
96.6
/100
|
#96
Exceptional
47.9%
Latvians
96.5
/100
|
#97
Exceptional
47.9%
Immigrants from North Macedonia
96.4
/100
|
#98
Exceptional
47.9%
Immigrants from Austria
96.4
/100
|
#99
Exceptional
47.9%
Immigrants from Italy
96.3
/100
|
#100
Exceptional
47.9%
Turks
96.1
/100
|
#101
Exceptional
47.8%
Slavs
96.0
/100
|
#102
Exceptional
47.8%
Hawaiians
96.0
/100
|
#103
Exceptional
47.8%
Immigrants from South Africa
96.0
/100
|
#104
Exceptional
47.8%
Immigrants from Czechoslovakia
95.5
/100
|
#105
Exceptional
47.8%

Immigrants from North Macedonia Married-couple Households Correlation Summary

MeasurementImmigrants from North Macedonia DataMarried-couple Households Data
Minimum0.019%28.5%
Maximum12.8%85.7%
Range12.7%57.2%
Mean1.9%51.1%
Median1.2%50.5%
Interquartile 25% (IQ1)0.61%47.9%
Interquartile 75% (IQ3)2.2%54.8%
Interquartile Range (IQR)1.6%6.9%
Standard Deviation (Sample)2.4%9.2%
Standard Deviation (Population)2.4%9.0%

Correlation Details

Immigrants from North Macedonia PercentileSample SizeMarried-couple Households
[
0.0%
-
0.5%
]
0.019%
59,714,26240.4%
[
0.0%
-
0.5%
]
0.093%
6,293,28348.7%
[
0.0%
-
0.5%
]
0.16%
2,698,99348.0%
[
0.0%
-
0.5%
]
0.22%
1,838,78749.7%
[
0.0%
-
0.5%
]
0.28%
899,21853.5%
[
0.0%
-
0.5%
]
0.35%
644,56449.3%
[
0.0%
-
0.5%
]
0.42%
283,41251.0%
[
0.0%
-
0.5%
]
0.48%
373,92056.1%
[
0.5%
-
1.0%
]
0.53%
256,68547.4%
[
0.5%
-
1.0%
]
0.61%
240,33548.8%
[
0.5%
-
1.0%
]
0.66%
210,73751.6%
[
0.5%
-
1.0%
]
0.74%
96,67844.2%
[
0.5%
-
1.0%
]
0.80%
153,21058.7%
[
0.5%
-
1.0%
]
0.86%
25,28855.3%
[
0.5%
-
1.0%
]
0.92%
12,82363.0%
[
1.0%
-
1.5%
]
1.01%
32,85154.8%
[
1.0%
-
1.5%
]
1.04%
13,88264.1%
[
1.0%
-
1.5%
]
1.12%
52,03348.1%
[
1.0%
-
1.5%
]
1.18%
61,81553.2%
[
1.0%
-
1.5%
]
1.26%
34,75051.1%
[
1.0%
-
1.5%
]
1.30%
20,43447.3%
[
1.0%
-
1.5%
]
1.37%
82,20845.9%
[
1.0%
-
1.5%
]
1.48%
43,30453.2%
[
1.5%
-
2.0%
]
1.68%
3,03534.0%
[
1.5%
-
2.0%
]
1.76%
16,75128.5%
[
1.5%
-
2.0%
]
1.85%
42,52251.9%
[
1.5%
-
2.0%
]
1.95%
26,00355.0%
[
2.0%
-
2.5%
]
2.12%
16,84238.3%
[
2.0%
-
2.5%
]
2.19%
4,43944.8%
[
2.0%
-
2.5%
]
2.38%
3,78148.1%
[
2.5%
-
3.0%
]
2.82%
64,94447.9%
[
3.0%
-
3.5%
]
3.22%
10,94249.9%
[
3.0%
-
3.5%
]
3.47%
2,99953.2%
[
3.5%
-
4.0%
]
3.61%
21,80652.4%
[
4.0%
-
4.5%
]
4.16%
40948.2%
[
4.0%
-
4.5%
]
4.33%
1,40960.4%
[
8.0%
-
8.5%
]
8.07%
1,30159.2%
[
12.5%
-
13.0%
]
12.77%
14185.7%