Immigrants from Armenia Married-couple Households
COMPARE
Immigrants from Armenia
Select to Compare
Married-couple Households
Immigrants from Armenia Married-couple Households
44.3%
MARRIED-COUPLE HOUSEHOLDS
0.7/ 100
METRIC RATING
244th/ 347
METRIC RANK
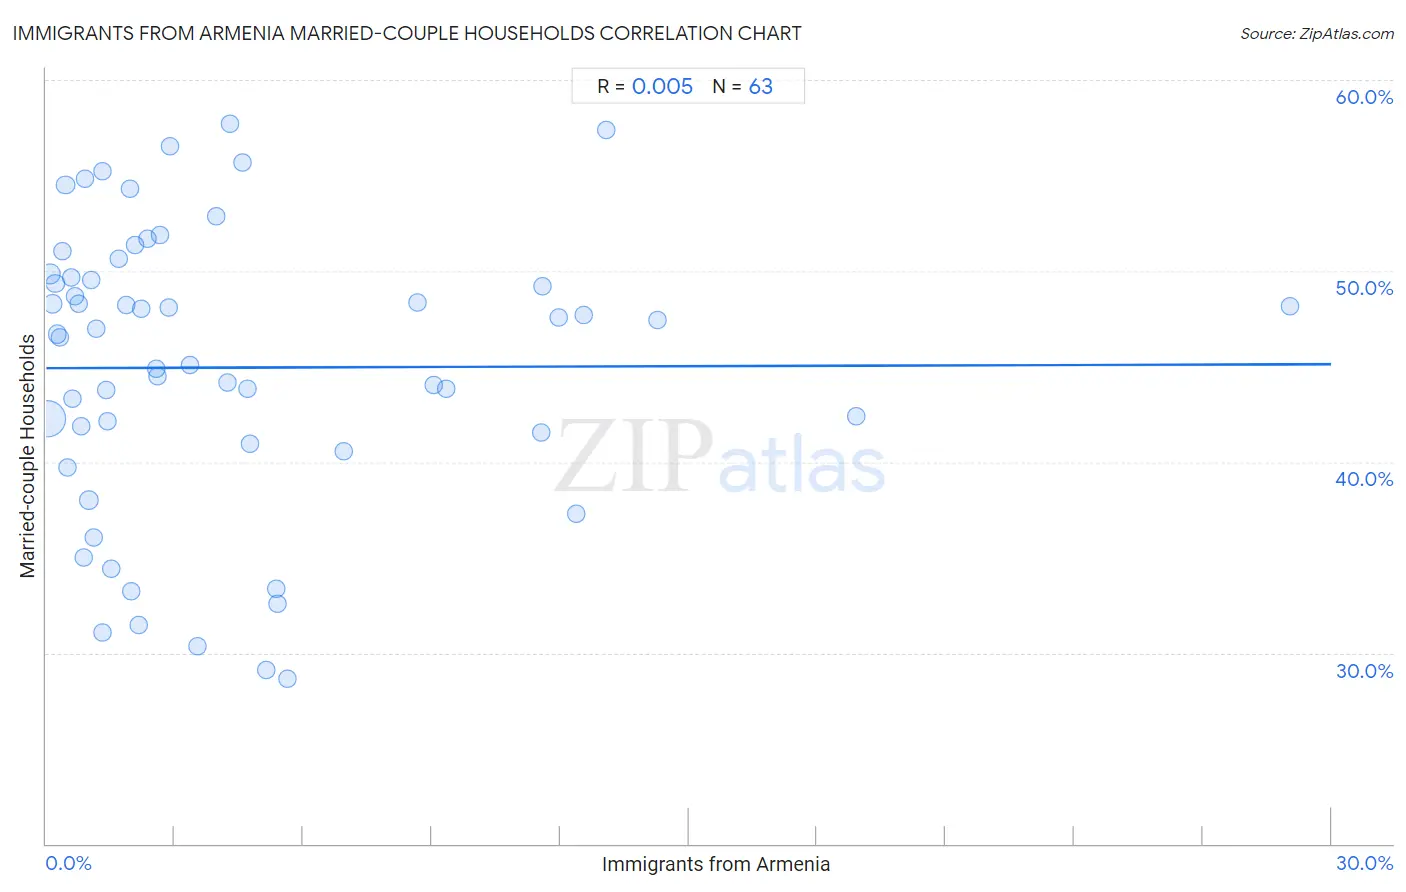
Immigrants from Armenia Married-couple Households Correlation Chart
The statistical analysis conducted on geographies consisting of 97,683,198 people shows no correlation between the proportion of Immigrants from Armenia and percentage of married-couple family households in the United States with a correlation coefficient (R) of 0.005 and weighted average of 44.3%. On average, for every 1% (one percent) increase in Immigrants from Armenia within a typical geography, there is an increase of 0.0068% in percentage of married-couple family households.
It is essential to understand that the correlation between the percentage of Immigrants from Armenia and percentage of married-couple family households does not imply a direct cause-and-effect relationship. It remains uncertain whether the presence of Immigrants from Armenia influences an upward or downward trend in the level of percentage of married-couple family households within an area, or if Immigrants from Armenia simply ended up residing in those areas with higher or lower levels of percentage of married-couple family households due to other factors.
Demographics Similar to Immigrants from Armenia by Married-couple Households
In terms of married-couple households, the demographic groups most similar to Immigrants from Armenia are Immigrants from El Salvador (44.3%, a difference of 0.010%), Immigrants from Cuba (44.2%, a difference of 0.16%), Immigrants from Morocco (44.2%, a difference of 0.16%), Immigrants from Saudi Arabia (44.4%, a difference of 0.28%), and Immigrants from Albania (44.4%, a difference of 0.35%).
| Demographics | Rating | Rank | Married-couple Households |
| Comanche | 1.2 /100 | #237 | Tragic 44.5% |
| Immigrants from Uruguay | 1.1 /100 | #238 | Tragic 44.5% |
| Spanish Americans | 1.1 /100 | #239 | Tragic 44.5% |
| Ute | 1.0 /100 | #240 | Tragic 44.4% |
| Immigrants from Bosnia and Herzegovina | 1.0 /100 | #241 | Tragic 44.4% |
| Immigrants from Albania | 1.0 /100 | #242 | Tragic 44.4% |
| Immigrants from Saudi Arabia | 0.9 /100 | #243 | Tragic 44.4% |
| Immigrants from Armenia | 0.7 /100 | #244 | Tragic 44.3% |
| Immigrants from El Salvador | 0.7 /100 | #245 | Tragic 44.3% |
| Immigrants from Cuba | 0.6 /100 | #246 | Tragic 44.2% |
| Immigrants from Morocco | 0.6 /100 | #247 | Tragic 44.2% |
| Yup'ik | 0.4 /100 | #248 | Tragic 44.1% |
| Immigrants from Kenya | 0.4 /100 | #249 | Tragic 44.1% |
| French American Indians | 0.4 /100 | #250 | Tragic 44.1% |
| German Russians | 0.4 /100 | #251 | Tragic 44.0% |
Immigrants from Armenia Married-couple Households Correlation Summary
| Measurement | Immigrants from Armenia Data | Married-couple Households Data |
| Minimum | 0.020% | 28.6% |
| Maximum | 29.0% | 57.7% |
| Range | 29.0% | 29.0% |
| Mean | 4.3% | 44.9% |
| Median | 2.2% | 46.7% |
| Interquartile 25% (IQ1) | 0.92% | 41.0% |
| Interquartile 75% (IQ3) | 5.4% | 49.6% |
| Interquartile Range (IQR) | 4.5% | 8.7% |
| Standard Deviation (Sample) | 5.3% | 7.5% |
| Standard Deviation (Population) | 5.3% | 7.4% |
Correlation Details
| Immigrants from Armenia Percentile | Sample Size | Married-couple Households |
[ 0.0% - 0.5% ] 0.020% | 71,855,748 | 42.2% |
[ 0.0% - 0.5% ] 0.084% | 8,243,016 | 49.8% |
[ 0.0% - 0.5% ] 0.14% | 4,414,104 | 48.3% |
[ 0.0% - 0.5% ] 0.21% | 2,320,395 | 49.4% |
[ 0.0% - 0.5% ] 0.26% | 1,852,360 | 46.7% |
[ 0.0% - 0.5% ] 0.33% | 675,511 | 46.5% |
[ 0.0% - 0.5% ] 0.39% | 615,896 | 51.0% |
[ 0.0% - 0.5% ] 0.45% | 469,570 | 54.5% |
[ 0.5% - 1.0% ] 0.51% | 96,691 | 39.7% |
[ 0.5% - 1.0% ] 0.57% | 174,401 | 49.6% |
[ 0.5% - 1.0% ] 0.62% | 402,936 | 43.3% |
[ 0.5% - 1.0% ] 0.66% | 118,743 | 48.7% |
[ 0.5% - 1.0% ] 0.74% | 225,375 | 48.3% |
[ 0.5% - 1.0% ] 0.82% | 99,576 | 41.8% |
[ 0.5% - 1.0% ] 0.87% | 32,730 | 35.0% |
[ 0.5% - 1.0% ] 0.92% | 104,155 | 54.8% |
[ 0.5% - 1.0% ] 0.98% | 3,932,718 | 38.0% |
[ 1.0% - 1.5% ] 1.06% | 160,333 | 49.5% |
[ 1.0% - 1.5% ] 1.11% | 126,181 | 36.0% |
[ 1.0% - 1.5% ] 1.17% | 121,433 | 47.0% |
[ 1.0% - 1.5% ] 1.30% | 42,915 | 31.1% |
[ 1.0% - 1.5% ] 1.32% | 20,092 | 55.2% |
[ 1.0% - 1.5% ] 1.41% | 91,800 | 43.8% |
[ 1.0% - 1.5% ] 1.44% | 64,674 | 42.1% |
[ 1.5% - 2.0% ] 1.51% | 2,988 | 34.4% |
[ 1.5% - 2.0% ] 1.70% | 63,193 | 50.6% |
[ 1.5% - 2.0% ] 1.87% | 7,126 | 48.2% |
[ 1.5% - 2.0% ] 1.95% | 120,343 | 54.3% |
[ 1.5% - 2.0% ] 1.99% | 2,264 | 33.2% |
[ 2.0% - 2.5% ] 2.08% | 42,719 | 51.4% |
[ 2.0% - 2.5% ] 2.16% | 34,649 | 31.4% |
[ 2.0% - 2.5% ] 2.22% | 60,245 | 48.0% |
[ 2.0% - 2.5% ] 2.36% | 87,047 | 51.7% |
[ 2.5% - 3.0% ] 2.56% | 36,619 | 44.9% |
[ 2.5% - 3.0% ] 2.60% | 67,937 | 44.5% |
[ 2.5% - 3.0% ] 2.65% | 5,474 | 51.9% |
[ 2.5% - 3.0% ] 2.86% | 2,451 | 48.1% |
[ 2.5% - 3.0% ] 2.88% | 30,333 | 56.5% |
[ 3.0% - 3.5% ] 3.36% | 2,529 | 45.1% |
[ 3.5% - 4.0% ] 3.52% | 3,322 | 30.3% |
[ 3.5% - 4.0% ] 3.97% | 27,479 | 52.9% |
[ 4.0% - 4.5% ] 4.23% | 76,335 | 44.1% |
[ 4.0% - 4.5% ] 4.29% | 53,862 | 57.7% |
[ 4.5% - 5.0% ] 4.58% | 15,377 | 55.7% |
[ 4.5% - 5.0% ] 4.71% | 60,344 | 43.8% |
[ 4.5% - 5.0% ] 4.77% | 55,451 | 41.0% |
[ 5.0% - 5.5% ] 5.14% | 45,764 | 29.1% |
[ 5.0% - 5.5% ] 5.38% | 93 | 33.3% |
[ 5.0% - 5.5% ] 5.41% | 7,509 | 32.6% |
[ 5.5% - 6.0% ] 5.64% | 14,386 | 28.6% |
[ 6.5% - 7.0% ] 6.95% | 54,643 | 40.6% |
[ 8.5% - 9.0% ] 8.68% | 27,119 | 48.4% |
[ 9.0% - 9.5% ] 9.04% | 51,654 | 44.0% |
[ 9.0% - 9.5% ] 9.35% | 18,951 | 43.8% |
[ 11.5% - 12.0% ] 11.54% | 18,445 | 41.5% |
[ 11.5% - 12.0% ] 11.59% | 22,831 | 49.2% |
[ 11.5% - 12.0% ] 11.97% | 194,512 | 47.6% |
[ 12.0% - 12.5% ] 12.39% | 16,679 | 37.3% |
[ 12.5% - 13.0% ] 12.54% | 32,294 | 47.7% |
[ 13.0% - 13.5% ] 13.08% | 650 | 57.4% |
[ 14.0% - 14.5% ] 14.26% | 22,163 | 47.4% |
[ 18.5% - 19.0% ] 18.91% | 35,755 | 42.4% |
[ 29.0% - 29.5% ] 29.03% | 310 | 48.2% |