Immigrants from Italy Married-couple Households

COMPARE

Immigrants from Italy
Race
Ancestry
AfghanAfricanAlaska NativeAlaskan AthabascanAlbanianAleutAlsatianAmericanApacheArabArapahoArgentineanArmenianAssyrian/Chaldean/SyriacAustralianAustrianBahamianBangladeshiBarbadianBasqueBelgianBelizeanBermudanBhutaneseBlackfeetBolivianBrazilianBritishBritish West IndianBulgarianBurmeseCajunCambodianCanadianCape VerdeanCarpatho RusynCelticCentral AmericanCentral American IndianCherokeeCheyenneChickasawChileanChineseChippewaChoctawColombianColvilleComancheCosta RicanCreeCreekCroatianCrowCubanCypriotCzechCzechoslovakianDanishDelawareDominicanDutchDutch West IndianEastern EuropeanEcuadorianEgyptianEnglishEstonianEthiopianEuropeanFijianFilipinoFinnishFrenchFrench American IndianFrench CanadianGermanGerman RussianGhanaianGreekGuamanian/ChamorroGuatemalanGuyaneseHaitianHmongHonduranHopiHoumaHungarianIcelanderIndian (Asian)IndonesianInupiatIranianIraqiIrishIroquoisIsraeliItalianJamaicanJapaneseJordanianKenyanKiowaKoreanLaotianLatvianLebaneseLiberianLithuanianLumbeeLuxembourgerMacedonianMalaysianMalteseMarshalleseMenomineeMexicanMexican American IndianMongolianMoroccanNative HawaiianNavajoNepaleseNew ZealanderNicaraguanNigerianNorthern EuropeanNorwegianOkinawanOsageOttawaPaiutePakistaniPalestinianPanamanianParaguayanPennsylvania GermanPeruvianPimaPolishPortuguesePotawatomiPuebloPuerto RicanPuget Sound SalishRomanianRussianSalvadoranSamoanScandinavianScotch-IrishScottishSeminoleSenegaleseSerbianShoshoneSierra LeoneanSiouxSlavicSlovakSloveneSomaliSouth AfricanSouth AmericanSouth American IndianSoviet UnionSpaniardSpanishSpanish AmericanSpanish American IndianSri LankanSubsaharan AfricanSudaneseSwedishSwissSyrianTaiwaneseThaiTlingit-HaidaTohono O'OdhamTonganTrinidadian and TobagonianTsimshianTurkishU.S. Virgin IslanderUgandanUkrainianUruguayanUteVenezuelanVietnameseWelshWest IndianYakamaYaquiYugoslavianYumanYup'ikZimbabwean
Immigration
NonimmigrantsImmigrantsAfghanistanAfricaAlbaniaArgentinaArmeniaAsiaAustraliaAustriaBahamasBangladeshBarbadosBelarusBelgiumBelizeBoliviaBosnia and HerzegovinaBrazilBulgariaBurma/MyanmarCabo VerdeCambodiaCameroonCanadaCaribbeanCentral AmericaChileChinaColombiaCongoCosta RicaCroatiaCubaCzechoslovakiaDenmarkDominicaDominican RepublicEastern AfricaEastern AsiaEastern EuropeEcuadorEgyptEl SalvadorEnglandEritreaEthiopiaEuropeFijiFranceGermanyGhanaGreeceGrenadaGuatemalaGuyanaHaitiHondurasHong KongHungaryIndiaIndonesiaIranIraqIrelandIsraelItalyJamaicaJapanJordanKazakhstanKenyaKoreaKuwaitLaosLatin AmericaLatviaLebanonLiberiaLithuaniaMalaysiaMexicoMicronesiaMiddle AfricaMoldovaMoroccoNepalNetherlandsNicaraguaNigeriaNorth AmericaNorth MacedoniaNorthern AfricaNorthern EuropeNorwayOceaniaPakistanPanamaPeruPhilippinesPolandPortugalRomaniaRussiaSaudi ArabiaScotlandSenegalSerbiaSierra LeoneSingaporeSomaliaSouth AfricaSouth AmericaSouth Central AsiaSouth Eastern AsiaSouthern EuropeSpainSri LankaSt. Vincent and the GrenadinesSudanSwedenSwitzerlandSyriaTaiwanThailandTrinidad and TobagoTurkeyUgandaUkraineUruguayUzbekistanVenezuelaVietnamWest IndiesWestern AfricaWestern AsiaWestern EuropeYemenZaireZimbabweAzores
Select to Compare
Race
Ancestry
AfghanAfricanAlaska NativeAlaskan AthabascanAlbanianAleutAlsatianAmericanApacheArabArapahoArgentineanArmenianAssyrian/Chaldean/SyriacAustralianAustrianBahamianBangladeshiBarbadianBasqueBelgianBelizeanBermudanBhutaneseBlackfeetBolivianBrazilianBritishBritish West IndianBulgarianBurmeseCajunCambodianCanadianCape VerdeanCarpatho RusynCelticCentral AmericanCentral American IndianCherokeeCheyenneChickasawChileanChineseChippewaChoctawColombianColvilleComancheCosta RicanCreeCreekCroatianCrowCubanCypriotCzechCzechoslovakianDanishDelawareDominicanDutchDutch West IndianEastern EuropeanEcuadorianEgyptianEnglishEstonianEthiopianEuropeanFijianFilipinoFinnishFrenchFrench American IndianFrench CanadianGermanGerman RussianGhanaianGreekGuamanian/ChamorroGuatemalanGuyaneseHaitianHmongHonduranHopiHoumaHungarianIcelanderIndian (Asian)IndonesianInupiatIranianIraqiIrishIroquoisIsraeliItalianJamaicanJapaneseJordanianKenyanKiowaKoreanLaotianLatvianLebaneseLiberianLithuanianLumbeeLuxembourgerMacedonianMalaysianMalteseMarshalleseMenomineeMexicanMexican American IndianMongolianMoroccanNative HawaiianNavajoNepaleseNew ZealanderNicaraguanNigerianNorthern EuropeanNorwegianOkinawanOsageOttawaPaiutePakistaniPalestinianPanamanianParaguayanPennsylvania GermanPeruvianPimaPolishPortuguesePotawatomiPuebloPuerto RicanPuget Sound SalishRomanianRussianSalvadoranSamoanScandinavianScotch-IrishScottishSeminoleSenegaleseSerbianShoshoneSierra LeoneanSiouxSlavicSlovakSloveneSomaliSouth AfricanSouth AmericanSouth American IndianSoviet UnionSpaniardSpanishSpanish AmericanSpanish American IndianSri LankanSubsaharan AfricanSudaneseSwedishSwissSyrianTaiwaneseThaiTlingit-HaidaTohono O'OdhamTonganTrinidadian and TobagonianTsimshianTurkishU.S. Virgin IslanderUgandanUkrainianUruguayanUteVenezuelanVietnameseWelshWest IndianYakamaYaquiYugoslavianYumanYup'ikZimbabwean
Immigration
NonimmigrantsImmigrantsAfghanistanAfricaAlbaniaArgentinaArmeniaAsiaAustraliaAustriaBahamasBangladeshBarbadosBelarusBelgiumBelizeBoliviaBosnia and HerzegovinaBrazilBulgariaBurma/MyanmarCabo VerdeCambodiaCameroonCanadaCaribbeanCentral AmericaChileChinaColombiaCongoCosta RicaCroatiaCubaCzechoslovakiaDenmarkDominicaDominican RepublicEastern AfricaEastern AsiaEastern EuropeEcuadorEgyptEl SalvadorEnglandEritreaEthiopiaEuropeFijiFranceGermanyGhanaGreeceGrenadaGuatemalaGuyanaHaitiHondurasHong KongHungaryIndiaIndonesiaIranIraqIrelandIsraelJamaicaJapanJordanKazakhstanKenyaKoreaKuwaitLaosLatin AmericaLatviaLebanonLiberiaLithuaniaMalaysiaMexicoMicronesiaMiddle AfricaMoldovaMoroccoNepalNetherlandsNicaraguaNigeriaNorth AmericaNorth MacedoniaNorthern AfricaNorthern EuropeNorwayOceaniaPakistanPanamaPeruPhilippinesPolandPortugalRomaniaRussiaSaudi ArabiaScotlandSenegalSerbiaSierra LeoneSingaporeSomaliaSouth AfricaSouth AmericaSouth Central AsiaSouth Eastern AsiaSouthern EuropeSpainSri LankaSt. Vincent and the GrenadinesSudanSwedenSwitzerlandSyriaTaiwanThailandTrinidad and TobagoTurkeyUgandaUkraineUruguayUzbekistanVenezuelaVietnamWest IndiesWestern AfricaWestern AsiaWestern EuropeYemenZaireZimbabweAzores
Married-couple Households
Income
Poverty
Unemployment
Labor Participation
Family Structure
Vehicle Availability
Education Level
Disability

Immigrants from Italy Married-couple Households
Exceptional

47.9%
MARRIED-COUPLE HOUSEHOLDS
96.3/ 100
METRIC RATING
100th/ 347
METRIC RANK

Immigrants from Italy Married-couple Households Correlation Chart

The statistical analysis conducted on geographies consisting of 324,146,965 people shows a mild positive correlation between the proportion of Immigrants from Italy and percentage of married-couple family households in the United States with a correlation coefficient (R) of 0.364 and weighted average of 47.9%. On average, for every 1% (one percent) increase in Immigrants from Italy within a typical geography, there is an increase of 0.54% in percentage of married-couple family households.
Immigrants from Italy Married-couple Households
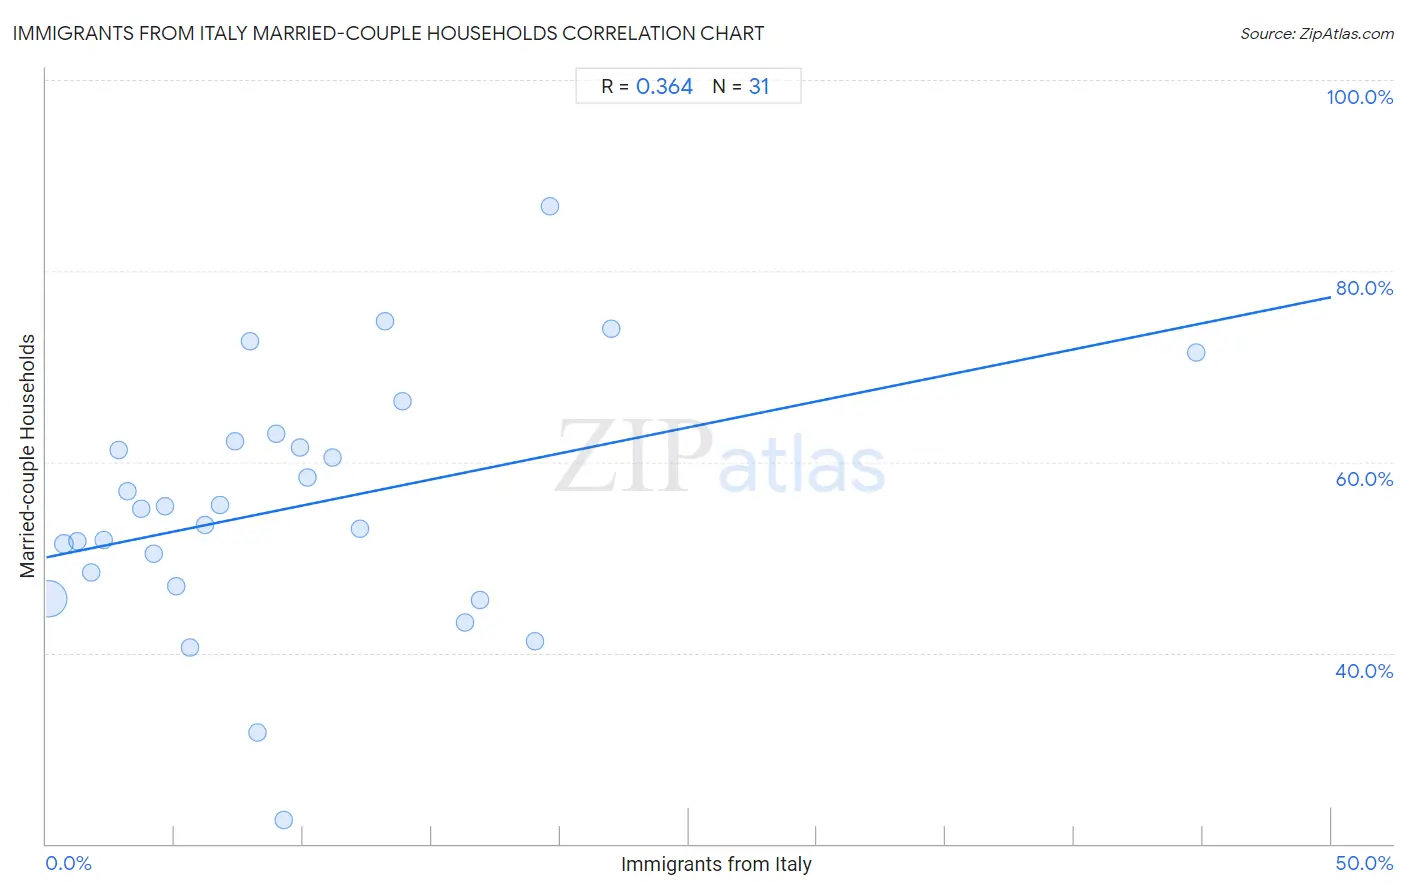
It is essential to understand that the correlation between the percentage of Immigrants from Italy and percentage of married-couple family households does not imply a direct cause-and-effect relationship. It remains uncertain whether the presence of Immigrants from Italy influences an upward or downward trend in the level of percentage of married-couple family households within an area, or if Immigrants from Italy simply ended up residing in those areas with higher or lower levels of percentage of married-couple family households due to other factors.

Demographics Similar to Immigrants from Italy by Married-couple Households

In terms of married-couple households, the demographic groups most similar to Immigrants from Italy are Immigrants from Austria (47.9%, a difference of 0.010%), Immigrants from North Macedonia (47.9%, a difference of 0.020%), Latvian (47.9%, a difference of 0.030%), Immigrants from Egypt (47.9%, a difference of 0.060%), and Turkish (47.8%, a difference of 0.060%).
DemographicsRating | RankMarried-couple Households
Lebanese
96.9
/100
|
#93
Exceptional
47.9%
Americans
96.9
/100
|
#94
Exceptional
47.9%
Immigrants from Belgium
96.8
/100
|
#95
Exceptional
47.9%
Immigrants from Egypt
96.6
/100
|
#96
Exceptional
47.9%
Latvians
96.5
/100
|
#97
Exceptional
47.9%
Immigrants from North Macedonia
96.4
/100
|
#98
Exceptional
47.9%
Immigrants from Austria
96.4
/100
|
#99
Exceptional
47.9%
Immigrants from Italy
96.3
/100
|
#100
Exceptional
47.9%
Turks
96.1
/100
|
#101
Exceptional
47.8%
Slavs
96.0
/100
|
#102
Exceptional
47.8%
Hawaiians
96.0
/100
|
#103
Exceptional
47.8%
Immigrants from South Africa
96.0
/100
|
#104
Exceptional
47.8%
Immigrants from Czechoslovakia
95.5
/100
|
#105
Exceptional
47.8%
Portuguese
95.5
/100
|
#106
Exceptional
47.8%
Estonians
94.7
/100
|
#107
Exceptional
47.7%

Immigrants from Italy Married-couple Households Correlation Summary

MeasurementImmigrants from Italy DataMarried-couple Households Data
Minimum0.12%22.5%
Maximum44.7%86.8%
Range44.6%64.2%
Mean9.6%55.3%
Median7.9%55.1%
Interquartile 25% (IQ1)3.7%47.0%
Interquartile 75% (IQ3)13.2%62.1%
Interquartile Range (IQR)9.5%15.1%
Standard Deviation (Sample)8.8%13.2%
Standard Deviation (Population)8.6%12.9%

Correlation Details

Immigrants from Italy PercentileSample SizeMarried-couple Households
[
0.0%
-
0.5%
]
0.12%
302,732,58045.6%
[
0.5%
-
1.0%
]
0.68%
15,218,35951.4%
[
1.0%
-
1.5%
]
1.21%
3,540,17251.7%
[
1.5%
-
2.0%
]
1.76%
1,204,49848.4%
[
2.0%
-
2.5%
]
2.23%
814,96551.8%
[
2.5%
-
3.0%
]
2.84%
132,91061.3%
[
3.0%
-
3.5%
]
3.18%
208,12556.9%
[
3.5%
-
4.0%
]
3.69%
84,01355.1%
[
4.0%
-
4.5%
]
4.20%
130,51150.4%
[
4.5%
-
5.0%
]
4.61%
19,53755.4%
[
5.0%
-
5.5%
]
5.07%
34,82047.0%
[
5.5%
-
6.0%
]
5.61%
2,95940.5%
[
6.0%
-
6.5%
]
6.18%
4,61453.4%
[
6.5%
-
7.0%
]
6.77%
3,76855.5%
[
7.0%
-
7.5%
]
7.37%
3,14962.1%
[
7.5%
-
8.0%
]
7.91%
1,91072.6%
[
8.0%
-
8.5%
]
8.24%
82531.7%
[
8.5%
-
9.0%
]
8.93%
1,16463.0%
[
9.0%
-
9.5%
]
9.23%
26022.5%
[
9.5%
-
10.0%
]
9.89%
1,29461.5%
[
10.0%
-
10.5%
]
10.17%
1,07258.4%
[
11.0%
-
11.5%
]
11.16%
23360.5%
[
12.0%
-
12.5%
]
12.20%
4152.9%
[
13.0%
-
13.5%
]
13.18%
2,99874.8%
[
13.5%
-
14.0%
]
13.84%
28966.4%
[
16.0%
-
16.5%
]
16.30%
9243.1%
[
16.5%
-
17.0%
]
16.88%
16045.6%
[
19.0%
-
19.5%
]
19.01%
14241.3%
[
19.5%
-
20.0%
]
19.58%
1,14486.8%
[
21.5%
-
22.0%
]
21.98%
32373.9%
[
44.5%
-
45.0%
]
44.74%
3871.4%