Scandinavian Married-couple Households
COMPARE
Scandinavian
Select to Compare
Married-couple Households
Scandinavian Married-couple Households
49.6%
MARRIED-COUPLE HOUSEHOLDS
99.9/ 100
METRIC RATING
20th/ 347
METRIC RANK
Scandinavian Married-couple Households Correlation Chart
The statistical analysis conducted on geographies consisting of 472,257,981 people shows a poor negative correlation between the proportion of Scandinavians and percentage of married-couple family households in the United States with a correlation coefficient (R) of -0.104 and weighted average of 49.6%. On average, for every 1% (one percent) increase in Scandinavians within a typical geography, there is a decrease of 0.12% in percentage of married-couple family households.
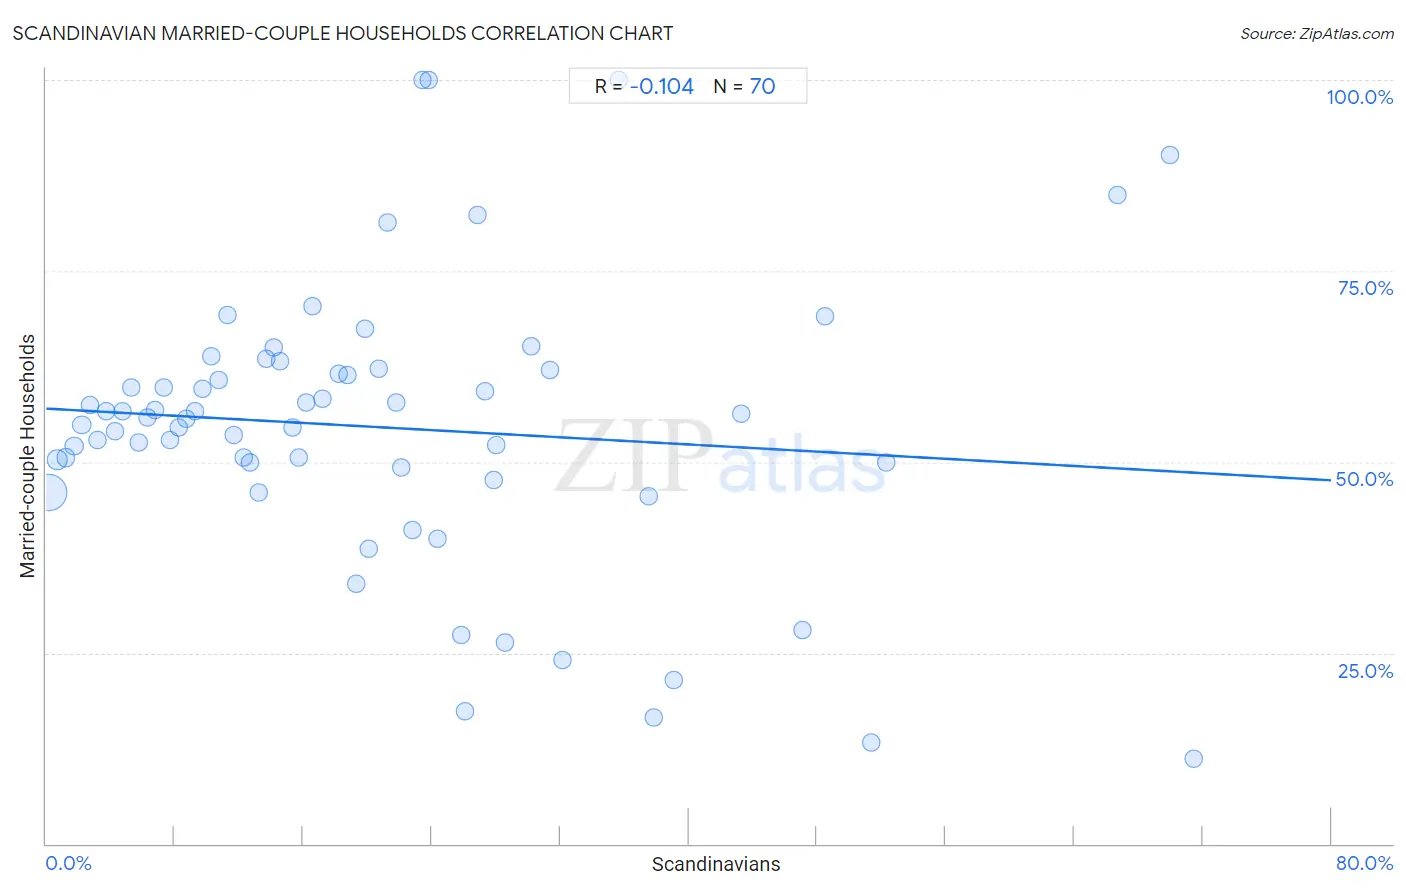
It is essential to understand that the correlation between the percentage of Scandinavians and percentage of married-couple family households does not imply a direct cause-and-effect relationship. It remains uncertain whether the presence of Scandinavians influences an upward or downward trend in the level of percentage of married-couple family households within an area, or if Scandinavians simply ended up residing in those areas with higher or lower levels of percentage of married-couple family households due to other factors.
Demographics Similar to Scandinavians by Married-couple Households
In terms of married-couple households, the demographic groups most similar to Scandinavians are European (49.6%, a difference of 0.0%), Norwegian (49.5%, a difference of 0.050%), Immigrants from Hong Kong (49.6%, a difference of 0.17%), English (49.6%, a difference of 0.17%), and Asian (49.5%, a difference of 0.17%).
| Demographics | Rating | Rank | Married-couple Households |
| Immigrants from Korea | 100.0 /100 | #13 | Exceptional 49.9% |
| Burmese | 100.0 /100 | #14 | Exceptional 49.8% |
| Koreans | 99.9 /100 | #15 | Exceptional 49.7% |
| Swedes | 99.9 /100 | #16 | Exceptional 49.7% |
| Immigrants from Hong Kong | 99.9 /100 | #17 | Exceptional 49.6% |
| English | 99.9 /100 | #18 | Exceptional 49.6% |
| Europeans | 99.9 /100 | #19 | Exceptional 49.6% |
| Scandinavians | 99.9 /100 | #20 | Exceptional 49.6% |
| Norwegians | 99.9 /100 | #21 | Exceptional 49.5% |
| Asians | 99.9 /100 | #22 | Exceptional 49.5% |
| Dutch | 99.9 /100 | #23 | Exceptional 49.5% |
| Czechs | 99.9 /100 | #24 | Exceptional 49.4% |
| Immigrants from Philippines | 99.9 /100 | #25 | Exceptional 49.3% |
| Immigrants from Scotland | 99.8 /100 | #26 | Exceptional 49.3% |
| Bhutanese | 99.8 /100 | #27 | Exceptional 49.3% |
Scandinavian Married-couple Households Correlation Summary
| Measurement | Scandinavian Data | Married-couple Households Data |
| Minimum | 0.19% | 11.1% |
| Maximum | 71.4% | 100.0% |
| Range | 71.2% | 88.9% |
| Mean | 20.9% | 54.5% |
| Median | 17.7% | 55.7% |
| Interquartile 25% (IQ1) | 8.7% | 49.3% |
| Interquartile 75% (IQ3) | 27.9% | 61.9% |
| Interquartile Range (IQR) | 19.2% | 12.6% |
| Standard Deviation (Sample) | 16.5% | 18.6% |
| Standard Deviation (Population) | 16.4% | 18.4% |
Correlation Details
| Scandinavian Percentile | Sample Size | Married-couple Households |
[ 0.0% - 0.5% ] 0.19% | 375,544,032 | 46.0% |
[ 0.5% - 1.0% ] 0.70% | 60,082,482 | 50.2% |
[ 1.0% - 1.5% ] 1.22% | 18,924,401 | 50.6% |
[ 1.5% - 2.0% ] 1.73% | 8,421,332 | 52.1% |
[ 2.0% - 2.5% ] 2.21% | 4,756,836 | 54.8% |
[ 2.5% - 3.0% ] 2.73% | 2,337,586 | 57.4% |
[ 3.0% - 3.5% ] 3.21% | 893,626 | 52.8% |
[ 3.5% - 4.0% ] 3.72% | 486,897 | 56.7% |
[ 4.0% - 4.5% ] 4.24% | 197,654 | 54.1% |
[ 4.5% - 5.0% ] 4.74% | 123,911 | 56.7% |
[ 5.0% - 5.5% ] 5.25% | 100,799 | 59.7% |
[ 5.5% - 6.0% ] 5.75% | 111,469 | 52.6% |
[ 6.0% - 6.5% ] 6.27% | 53,671 | 55.9% |
[ 6.5% - 7.0% ] 6.76% | 57,061 | 56.8% |
[ 7.0% - 7.5% ] 7.29% | 32,490 | 59.8% |
[ 7.5% - 8.0% ] 7.71% | 22,983 | 52.9% |
[ 8.0% - 8.5% ] 8.25% | 19,965 | 54.5% |
[ 8.5% - 9.0% ] 8.71% | 14,653 | 55.6% |
[ 9.0% - 9.5% ] 9.23% | 7,642 | 56.6% |
[ 9.5% - 10.0% ] 9.72% | 6,386 | 59.6% |
[ 10.0% - 10.5% ] 10.25% | 13,080 | 63.9% |
[ 10.5% - 11.0% ] 10.74% | 6,174 | 60.7% |
[ 11.0% - 11.5% ] 11.28% | 1,897 | 69.2% |
[ 11.5% - 12.0% ] 11.66% | 2,934 | 53.5% |
[ 12.0% - 12.5% ] 12.27% | 3,725 | 50.7% |
[ 12.5% - 13.0% ] 12.71% | 1,707 | 49.9% |
[ 13.0% - 13.5% ] 13.19% | 614 | 46.1% |
[ 13.5% - 14.0% ] 13.68% | 1,447 | 63.5% |
[ 14.0% - 14.5% ] 14.13% | 4,472 | 65.0% |
[ 14.5% - 15.0% ] 14.58% | 4,726 | 63.2% |
[ 15.0% - 15.5% ] 15.31% | 980 | 54.5% |
[ 15.5% - 16.0% ] 15.71% | 1,470 | 50.6% |
[ 16.0% - 16.5% ] 16.19% | 105 | 57.8% |
[ 16.5% - 17.0% ] 16.60% | 3,874 | 70.3% |
[ 17.0% - 17.5% ] 17.23% | 2,240 | 58.3% |
[ 18.0% - 18.5% ] 18.21% | 2,164 | 61.5% |
[ 18.5% - 19.0% ] 18.78% | 181 | 61.3% |
[ 19.0% - 19.5% ] 19.33% | 150 | 34.1% |
[ 19.5% - 20.0% ] 19.86% | 438 | 67.4% |
[ 20.0% - 20.5% ] 20.10% | 960 | 38.6% |
[ 20.5% - 21.0% ] 20.67% | 150 | 62.3% |
[ 21.0% - 21.5% ] 21.27% | 489 | 81.3% |
[ 21.5% - 22.0% ] 21.83% | 1,663 | 57.8% |
[ 22.0% - 22.5% ] 22.10% | 534 | 49.3% |
[ 22.5% - 23.0% ] 22.78% | 259 | 41.0% |
[ 23.0% - 23.5% ] 23.40% | 47 | 100.0% |
[ 23.5% - 24.0% ] 23.81% | 21 | 100.0% |
[ 24.0% - 24.5% ] 24.32% | 37 | 40.0% |
[ 25.5% - 26.0% ] 25.81% | 31 | 27.3% |
[ 26.0% - 26.5% ] 26.09% | 46 | 17.4% |
[ 26.5% - 27.0% ] 26.86% | 1,627 | 82.3% |
[ 27.0% - 27.5% ] 27.32% | 388 | 59.3% |
[ 27.5% - 28.0% ] 27.87% | 61 | 47.6% |
[ 28.0% - 28.5% ] 28.03% | 603 | 52.2% |
[ 28.5% - 29.0% ] 28.57% | 28 | 26.3% |
[ 30.0% - 30.5% ] 30.23% | 311 | 65.2% |
[ 31.0% - 31.5% ] 31.37% | 255 | 61.9% |
[ 32.0% - 32.5% ] 32.14% | 672 | 24.1% |
[ 35.5% - 36.0% ] 35.63% | 87 | 100.0% |
[ 37.0% - 37.5% ] 37.50% | 16 | 45.5% |
[ 37.5% - 38.0% ] 37.79% | 217 | 16.5% |
[ 39.0% - 39.5% ] 39.10% | 156 | 21.4% |
[ 43.0% - 43.5% ] 43.27% | 312 | 56.2% |
[ 47.0% - 47.5% ] 47.06% | 51 | 28.0% |
[ 48.0% - 48.5% ] 48.49% | 299 | 69.1% |
[ 51.0% - 51.5% ] 51.35% | 37 | 13.3% |
[ 52.0% - 52.5% ] 52.27% | 88 | 50.0% |
[ 66.5% - 67.0% ] 66.67% | 87 | 85.0% |
[ 69.5% - 70.0% ] 69.93% | 153 | 90.2% |
[ 71.0% - 71.5% ] 71.43% | 42 | 11.1% |